Earnings per share for the last twelve months: African Agriculture Inc. (AAGR)

High country risks and irrigation costs create significant barriers to expansion in Africa for African Agriculture (AAGR). The TTM net income per share visualizes the market reaction to these challenges, where -0.72 reflects the baseline level of the metric. Revenues are based on alfalfa exports from Senegal, while operational efficiency is maintained through flexible outsourcing of logistics and seasonal labor.

Analytical breakdowns for African Agriculture (AAGR)
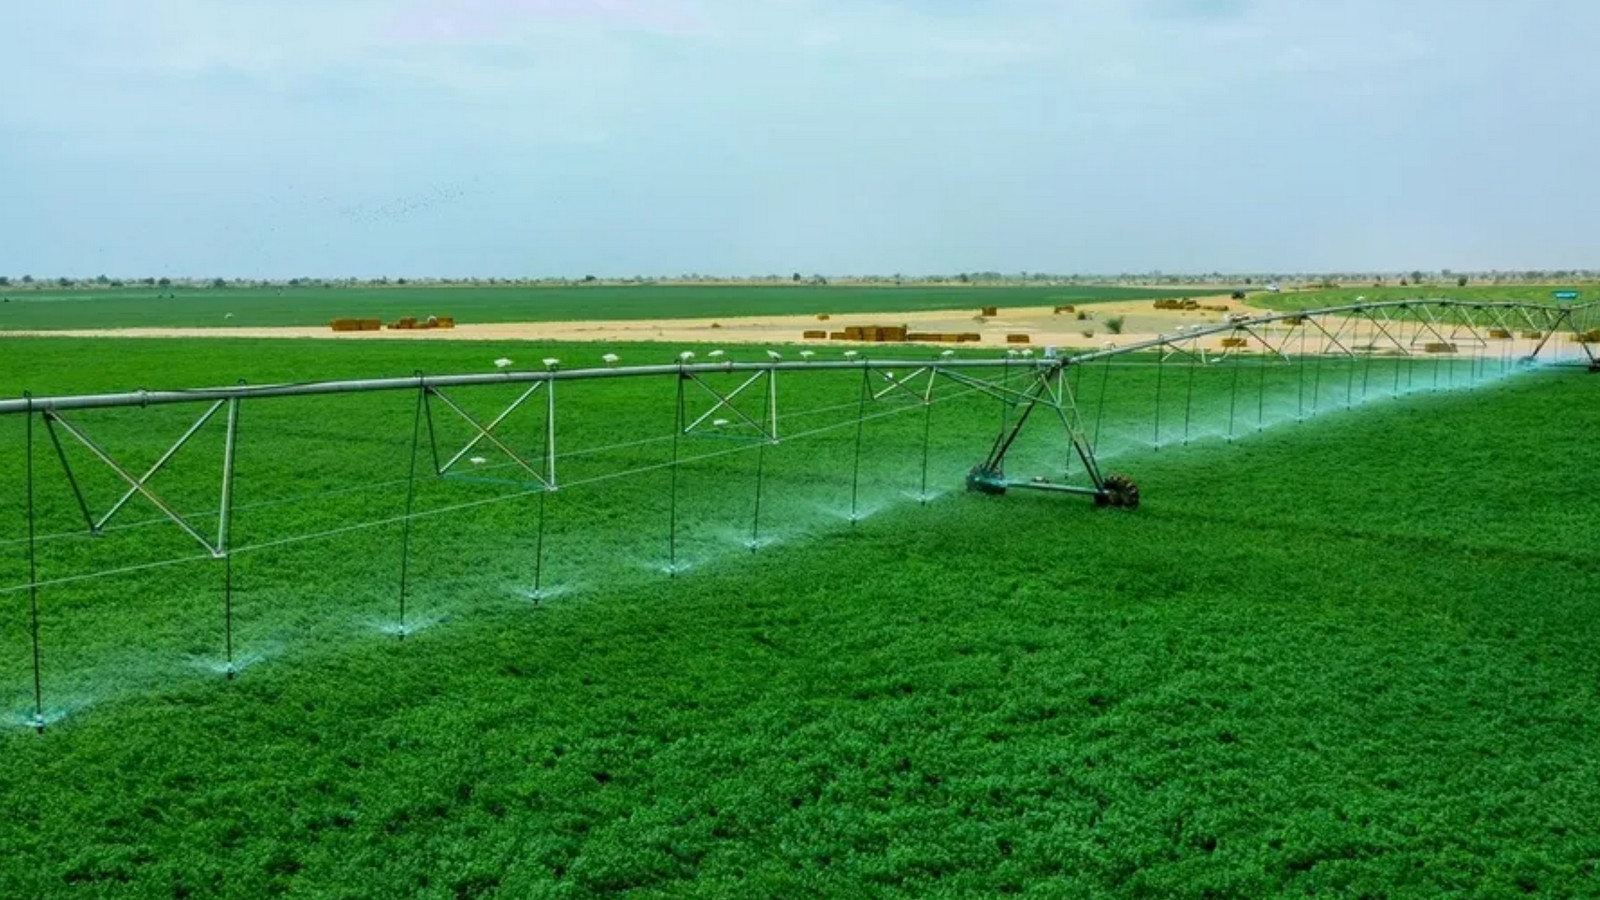
The efficiency of implementing biotechnologies in African agriculture reflects the annual net income per share trend for African Agriculture (AAGR). This indicator demonstrates the real business profitability available to the holder of each security. The calculation is based on dividing the total net income over the last twelve months by the total number of shares. Growth in this metric confirms the capitalization of innovations and R&D projects. Positive dynamics serve as a signal of the asset's fundamental stability.
