AGX (Argan Corp) Earnings per share for the last four quarters

Cash flow volatility for Argan, Inc. (AGX) is driven by the specific nature of large-scale energy projects, which this GURU.Markets daily chart reflects through the 12-month annual growth in earnings per share, where the 49.80 mark serves as a key metric. The EPC contract model creates a closed B2B environment expanding due to the green energy transition, while the absence of heavy assets and fixed margins ensure stable free cash flow generation.

Financial and market metric breakdowns for Argan, Inc. (AGX)
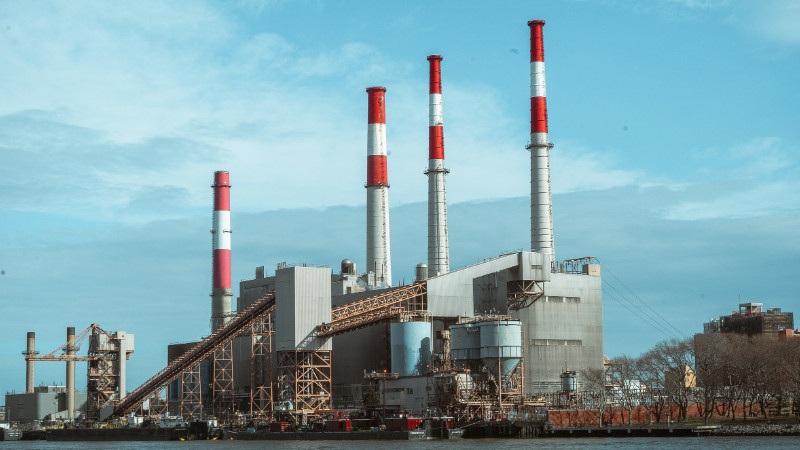
Argan, Inc. specialization in power system modernization and thermal power plant construction ensures a stable order backlog, directly impacting earnings per share. The relative YoY EPS growth over the last 12 months quantifies net income dynamics, allowing investors to distinguish sustainable business scaling from temporary spikes and assess the company's effectiveness in adapting to new market conditions.
