Akoya Biosciences Inc (AKYA) Business Payback Period

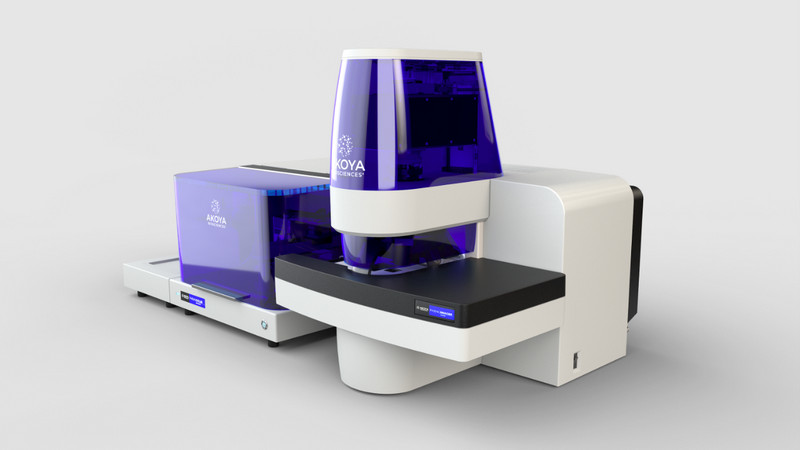
Akoya Biosciences dominates the spatial biology sector through PhenoCycler, which creates detailed maps of tumor zones for personalized treatment. This price chart on the GURU.Markets platform, where the indicator equals -1.30, visualizes this success. Akoya Biosciences generates revenue by supplying tissue analysis systems to pharmaceutical companies, creating a steady order flow and stable income from the sale of recurring consumables.

Analytical breakdowns for akoyabio.com (AKYA)
P/E reflects the market value of a single share relative to the business's share of net profit. This ratio measures the investment payback period, which is clearly demonstrated by the company's annual P/E. The current value of -1.30 allows for a comparison of the asset's valuation against US industry averages. A low level signals undervaluation, while an inflated one indicates a risk of correction. For Akoya Biosciences (AKYA), this metric confirms the capitalization of their closed spatial biology ecosystem.
