ALUR: Allurion Technologies Inc Price-to-Revenue Coefficient

Risks for Allurion Technologies (ALUR) are linked to intense pressure from new drugs and debt leverage, which is confirmed by the price-to-sales trend on this chart on GURU.Markets, where the value of 0.50 expresses the metric level. Cash flow stability depends on clinic expansion, while growth is based on the demand for the innovative swallowable balloon as an alternative to surgery.

Allurion Technologies Inc (ALUR) - metric breakdowns and financial figures
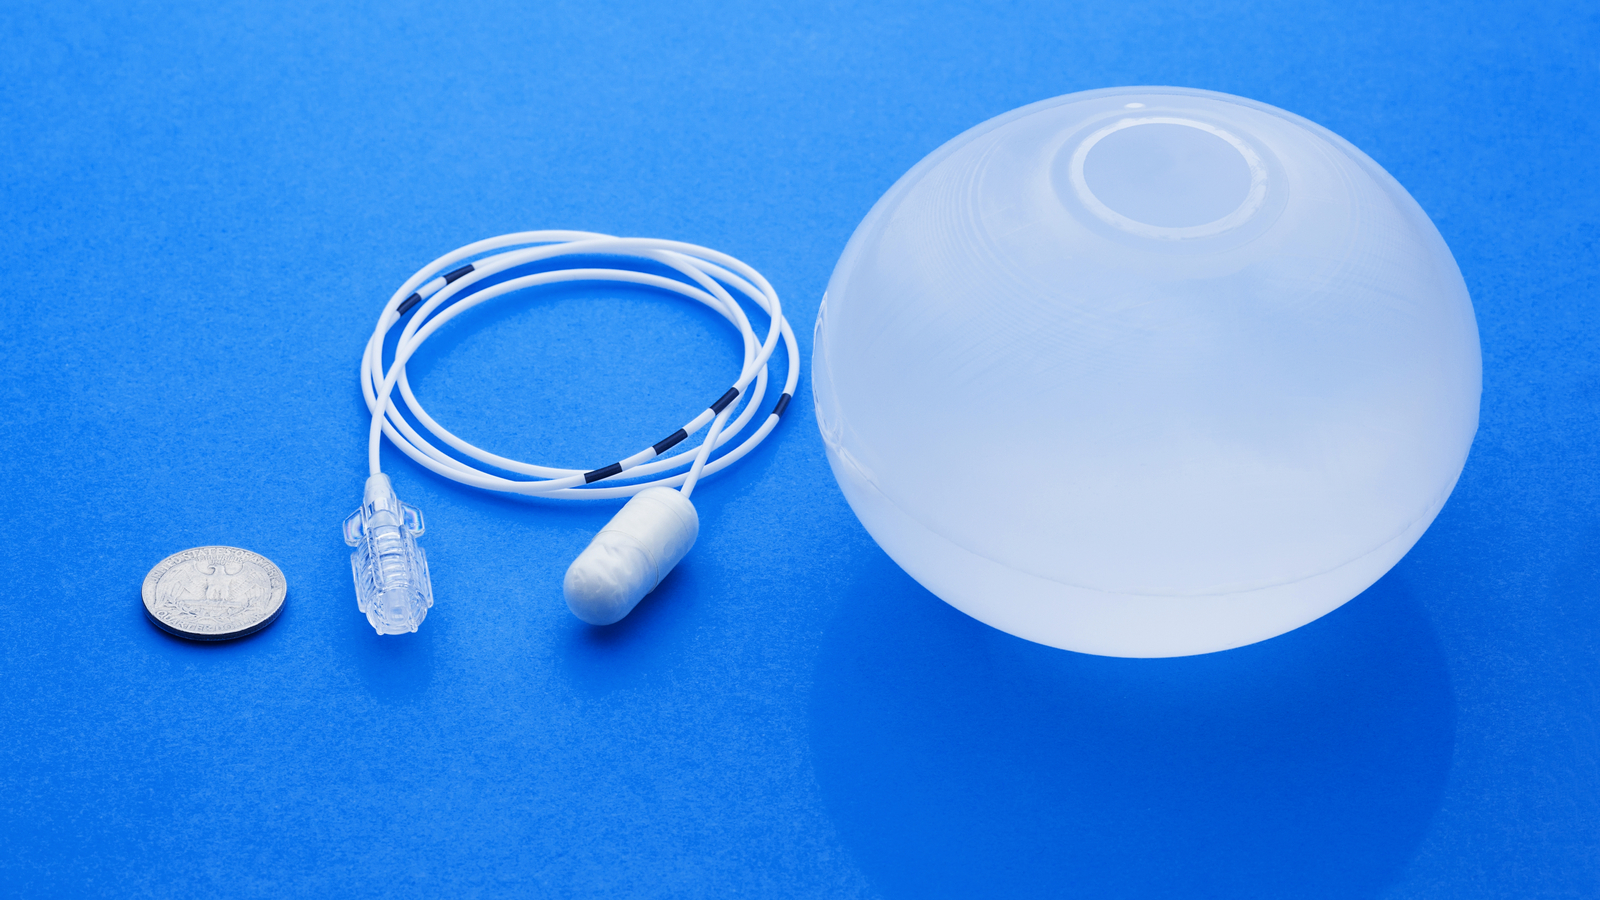
Assessing the scaling of Allurion Technologies (ALUR) through the price-to-sales ratio allows for a comparison of market expectations against actual sales volumes. This calculation measures the cost of every dollar of revenue, helping investors distinguish speculative growth from fundamental strengthening. By analyzing the company's price/sales multiple, one can evaluate the efficiency of deploying smart gastric balloons through partner clinics. The stability of this indicator confirms the resilience of the business model within the wellness programs sector.
