Applied DNA Sciences Inc (APDN) Price to Earnings Ratio

Corporate emblem and logo of Applied DNA Corp (APDN)

Applied DNA Sciences is recognized as an authoritative B2B leader in PCR diagnostics and molecular tags, as evidenced by the stock price action on the chart with a value of -0.10. The business relies on creating cargo anti-counterfeiting protection systems in global transit to increase margins. The development of the LinearDNA platform for mRNA vaccines and PCR tests for emerging viruses is driving the expansion of contracts in the textile and medical industries.

Applied DNA (APDN) P/E Multiple: for the period 07/04/2022 - 10/07/2025
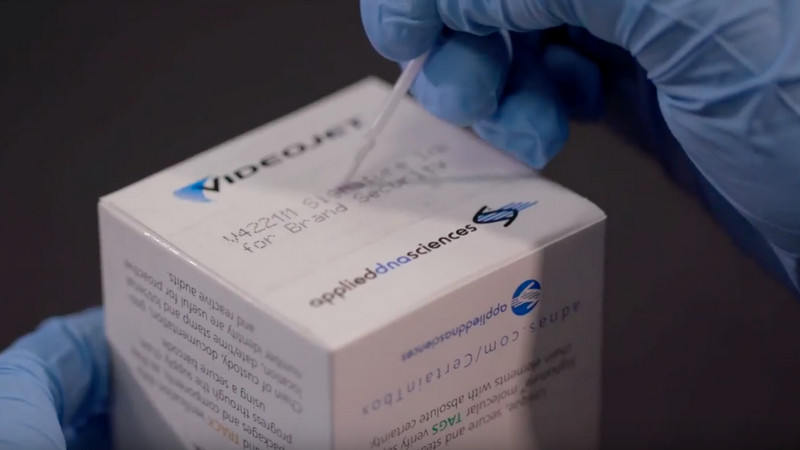
Product sample of Applied DNA Corp

Applied DNA Sciences occupies a specific niche within the biotechnology sector. The P/E chart for the issuer reflects the market value of a single share relative to the net income per share. This ratio measures the investment payback period, correlating current quotes with the actual efficiency of the business. For APDN , this metric is limited by inertial demand for laboratory services. The absence of large-scale commercial deals is constraining the growth of the company's fundamental value.

Analysis of competing companies

Tempus AI Inc - Market Cap to Net Income|Price to Earnings Ratio Qiagen (QGEN)|Price to Earnings Ratio IONS (Ionis Pharmaceuticals, Inc.)|P/E Multiple RGEN (Repligen Corp.)|Business Payback Period Avidity Corp (RNA)|CRISPR Therapeutics AG - P/E Multiple|Market Cap to Earnings genedx.com|RARE: P/E Multiple|Price to Earnings Multiple BEAM|Price to Earnings Ratio SRPT|TWST: Company Value to Net Income|P/E Multiple TXG|intelliatx.com - Price to Earnings Multiple|Price to Earnings Ratio Stoke Therapeutics, Inc. STOK|BLFS: Price to Earnings Multiple|Wave Life Sciences Corp - P/E Multiple|MAZE - P/E Multiple|SION (Sionna Therapeutics Inc) - Price to Earnings Ratio|primemedicine.com - Company Value to Net Income|Price to Earnings Ratio Taysha Gene Therapies, Inc.|uniQure NV (QURE) - Business Payback Period|P/E Multiple MGTX|Price to Earnings Ratio REGENXBIO Corp RGNX|P/E Multiple SLDB (Solid Biosciences Inc.)|Business Payback Period ocugen.com (OCGN)|PacBio - P/E Multiple|Market Cap to Earnings Benitec Biopharma Inc|Design Pharma (DSGN) - Price to Earnings Ratio|Price to Earnings Multiple RCKT|FDMT (4D Molecular Therapeutics) - P/E Multiple|Price to Earnings Ratio Lexeo (LXEO)|P/E Multiple KRRO|EDIT - Market Cap to Earnings|Price to Earnings Ratio Silence Therapeutics Inc. SLN|Business Payback Period ProQR (PRQR)|Codexis Bio - P/E Multiple|SGMO - P/E Multiple|nautilus.bio (NAUT) - Price to Earnings Ratio|Market Cap to Net Income MGX (Metagenomi Inc.)|DTIL (Precision BioSciences, Inc.) - P/E Multiple|Price to Earnings Multiple GBIO (Generation Bio Corp)|Price to Earnings Ratio Boundless Bio, Inc. (BOLD)|exicuretx.com - Price to Earnings Multiple|P/E Multiple IMNN (Imunon)|PHIO: Price to Earnings Multiple|MBIO - Price to Earnings Ratio|RNAZ (TransCode Therapeutics) - Price to Earnings Multiple|BNGO: P/E Multiple|bluebirdbio.com (BLUE) - P/E Multiple|IPA (ImmunoPrecise Antibodies Ltd) - P/E Multiple|P/E Multiple Omega Therapeutics Inc|Price to Earnings Ratio Singular Genomics Systems Inc (OMIC)|RGLS: Market Cap to Net Income|Price to Earnings Ratio Syros Pharmaceuticals SYRS|TBIO (telesisbio.com) - Market Cap to Net Income|TCON - Price to Earnings Ratio|UBX: Price to Earnings Ratio