ARAY: Accuray Inc Company Value to Net Income

Accuray Inc - graphic logo of issuer ARAY

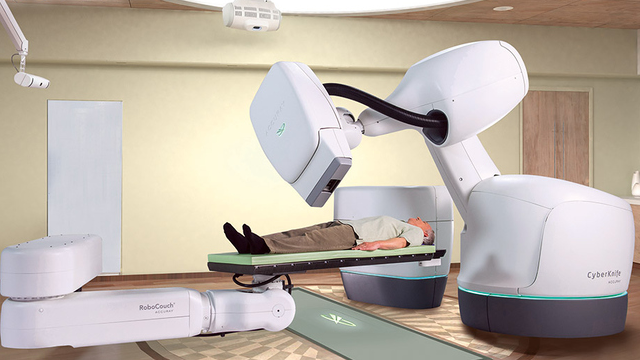
This chart of Accuray Incorporated (ARAY) share prices on the GURU.Markets platform, where the P/E ratio stands at -0.60, illustrates the company's strategy for the global expansion of CyberKnife systems across clinics. The business generates revenue through multi-year maintenance of high-cost therapy robots and staff training. The stability of the R&D center is maintained by retaining leading biomedical engineers and attracting specialized trainers.

Price to Earnings Ratio: Accuray Incorporated (ARAY) for 07/04/2022 - 11/12/2026
Flagship merchandise of Accuray

The P/E ratio reflects the relationship between the market value of Accuray Incorporated (ARAY) and its net income, revealing the actual efficiency of its capitalization. By analyzing changes in the company's P/E, an investor can determine the extent to which market expectations align with the business's ability to generate income. For a manufacturer of radiation therapy systems, this indicator is critical, as the high margins of service contracts must offset the high cost of robot assembly. The multiplier's dynamics make it possible to distinguish an undervalued asset from a pre-bankruptcy state.

Key competitors

ONC: Company Value to Net Income|Price to Earnings Ratio HALO (Halozyme)|RVMD (Revolution Medicines Inc) - Company Value to Net Income|P/E Multiple AAPG (Ascentage)|CGON - Price to Earnings Ratio|URGN: Price to Earnings Ratio|BCAX - P/E Multiple|Personalis (PSNL) - Price to Earnings Ratio|Erasca Inc - Company Value to Net Income|DCTH (Delcath) - P/E Multiple|Market Cap to Earnings Y-mAbs Corp YMAB|P/E Multiple AURA|P/E Multiple candeltx.com (CADL)|P/E Multiple SLS (SELLAS Life Sciences Group)|ACTU - Price to Earnings Ratio|Citius Oncology, Inc - P/E Multiple|TuHURA Biosciences, Inc. (HURA) - Price to Earnings Ratio|TARA (Protara Therapeutics) - Price to Earnings Ratio|fatetherapeutics.com (FATE) - P/E Multiple|Price to Earnings Ratio Aadi Bioscience, Inc.|TCRX: Company Value to Net Income|P/E Multiple CSBR|P/E Multiple xbiotech.com (XBIT)|CEL-SCI - Price to Earnings Ratio|ostherapies.com (OSTX) - Market Cap to Earnings|RADX: Price to Earnings Ratio|Company Value to Net Income ARTV (Artiva Biotherapeutics, Inc.)|ANL: P/E Multiple|VERU - Business Payback Period|Price to Earnings Ratio Tempest Therapeutics|Price to Earnings Multiple XLO (Xilio)|P/E Multiple RENB|Price to Earnings Ratio muraloncology.com MURA|Price to Earnings Ratio Kairos Pharma KAPA|OnKure Therapeutics, Inc. (OKUR) - Market Cap to Earnings|GDTC - Price to Earnings Ratio|Company Value to Net Income CRIS (Curis, Inc.)|apollomicsinc.com (APLM) - Price to Earnings Ratio|Market Cap to Net Income THAR (Tharimmune Inc)|Price to Earnings Ratio Advanced Biomed Inc.|Market Cap to Earnings Genprex Inc GNPX|Price to Earnings Ratio Calidi Biotherapeutics (CLDI)|SBFM (sunshinebiopharma.com) - Company Value to Net Income|P/E Multiple XBIO (Xenetic Biosciences, Inc.)|P/E Multiple Salarius Pharmaceuticals Inc SLRX|PPBT: Price to Earnings Ratio|American Oncology Network - Market Price to Net Income Ratio|BGNE: P/E Multiple|Market Cap to Earnings checkpointtx.com (CKPT)|ELEV (Elevation Oncology) - P/E Multiple|Price to Earnings Multiple ICAD (iCAD Corp)|P/E Multiple IKNA|P/E Multiple Notable Labs Corp (NTBL)|Price to Earnings Ratio Viracta Therapeutics, Inc. VIRX|Company Value to Net Income MOR|NAYA Biosciences Inc. - P/E Multiple|AAPGV - P/E Multiple