Ardmore Shipping Inc. - ASC Net earnings per one share for the last twelve months

Ardmore Shipping (ASC) is subject to sharp fluctuations due to freight rate volatility and geopolitics. This annual EPS TTM chart visualizes these fundamental shifts in profit. The value of 243.80 reflects the metric's balance, accounting for high fleet costs and the operating leverage effect. The company's revenues are based on the transport of chemicals and light petroleum products for global traders.

Ardmore Shipping Inc. - analytical breakdowns and key metrics (ASC)
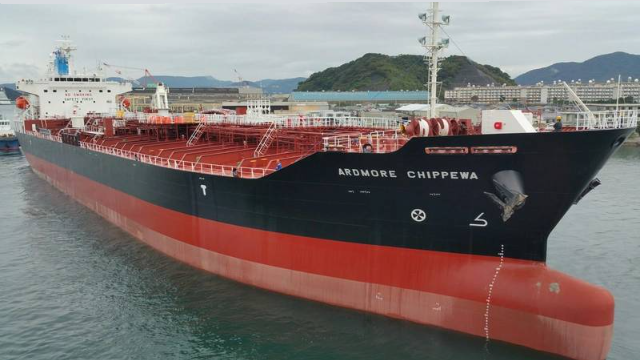
This indicator reflects the rolling annual rate of change in net income per share, capturing the daily transformation of margins and the business's ability to adapt pricing to inflationary shocks. Analyzing the historical annual dynamics of EPS TTM for Ardmore Shipping (ASC) reveals how geopolitical instability and the rerouting of maritime shipping lanes sharply increase freight rates, directly transforming operational risks into rapid profit growth.
