Net Margin: agapeatpgroup.com (ATPC)

Licensing complexities and strict sanitary oversight create high barriers to entry in metabolic pharma, yet an integrated wellness system in Asia ensures high customer loyalty, while a stable core of medical professionals supports the development of Agape ATP Corporation (ATPC). This chart, generated by the GURU.Markets system, utilizes the sales margin coefficient to link reports with prices, while the -114.80 indicator reflects current dynamics.

Metric breakdowns and analytics for agapeatpgroup.com (ATPC)
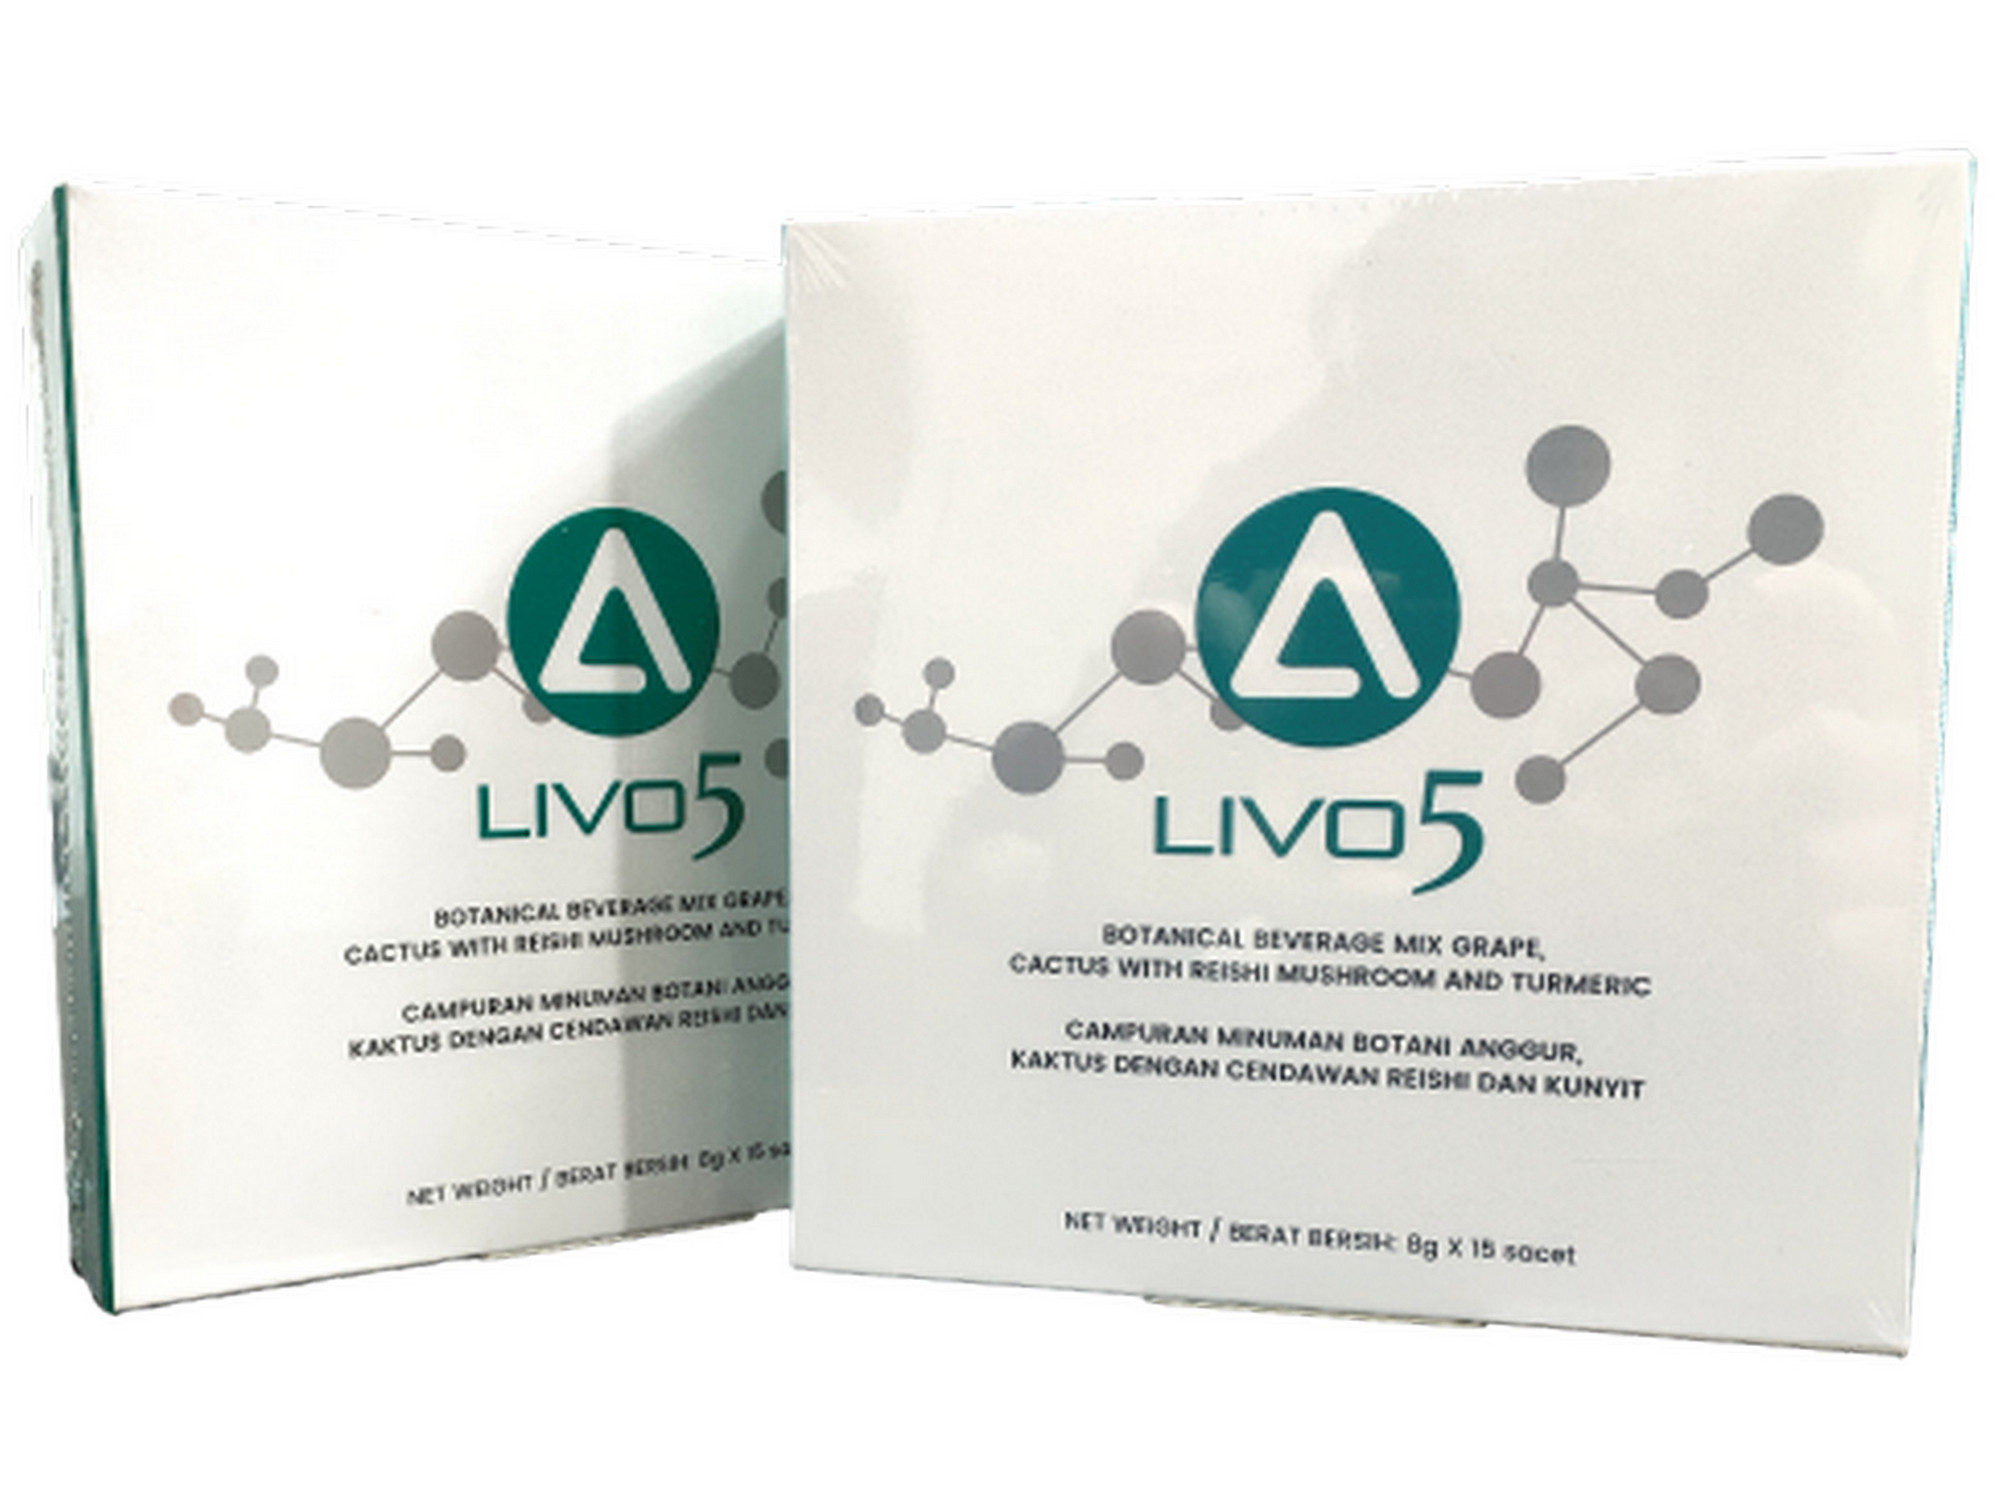
The investment attractiveness of Agape ATP Corporation (ATPC) depends on the efficiency of monetizing its wellness ecosystem in Asia. Sales margins determine the portion of profit remaining from each unit of revenue after covering all operating and financial expenses. By analyzing the net profitability chart, an investor assesses the business's ability to convert membership fees into real income. This indicator demonstrates the model's resilience to dietary supplement regulatory risks. Stable growth of this metric confirms the brand's capitalization.
