American Express Company (AXP) Business Payback Period

Corporate emblem and logo of American Express Co. (AXP)

The expected P/E of American Express (AXP) on the GURU.Markets chart demonstrates the stability of a mature business, where the indicator reaches 18.10. This stability is based on a premium customer base. Revenues rely on activity in tourism and business travel. System efficiency is ensured by a closed-loop acquiring cycle and growth in cardholder spending volume.

Amex (AXP): Price to Earnings Ratio from 07/04/2022 to 11/10/2026
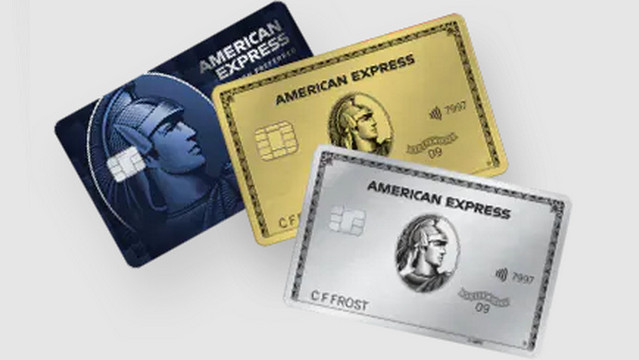
Original product of American Express Corp

The P/E ratio determines the market value of a single unit of profit, allowing for an assessment of the investment's payback period. A critical decline in this metric signals business degradation, while inflated values warn of overpayment. By analyzing the current P/E multiple, an investor distinguishes sustainable assets from value traps. For American Express (AXP), this indicator reflects the efficiency of credit risk management within the premium segment of payment systems.

Key competitors

V (visa.com) - Market Price to Net Income Ratio|Price to Earnings Ratio Mastercard (MA)|Business Payback Period Fiserv Inc|P/E Multiple PYPL (PayPal Inc.)|P/E Multiple Cash App XYZ|FIS - Price to Earnings Ratio|affirm.com (AFRM) - Price to Earnings Ratio|CPAY: P/E Multiple|Market Cap to Earnings Global Payments Inc (GPN)|Price to Earnings Ratio Shift4 Payments Inc|WEX: Company Value to Net Income|P/E Multiple STNE|Business Payback Period aciworldwide.com|P/E Multiple PAY (Paymentus)|DLO - Price to Earnings Ratio|Euronet Worldwide Inc - P/E Multiple|RELY - P/E Multiple|PagSeguro Digital Ltd. (PAGS) - Price to Earnings Ratio|Price to Earnings Multiple NATL|Price to Earnings Ratio WU|MQ: Company Value to Net Income|P/E Multiple PAYO|EVTC - Market Cap to Earnings|CompoSecure, Inc. - Price to Earnings Ratio|NYAX: Price to Earnings Multiple|IDT - Price to Earnings Ratio|Market Cap to Net Income FLYW|i3 Verticals Corp (IIIV) - Price to Earnings Ratio|Paysafe Corp - Company Value to Net Income|CTLP (Cantaloupe, Inc.) - P/E Multiple|Market Cap to Earnings prth.com PRTH|Price to Earnings Ratio Cass Information Systems, Inc. (CASS)|Business Payback Period REPAY|Price to Earnings Ratio International Money Express Inc IMXI|Business Payback Period Lesaka Corp (LSAK)|Paysign, Inc. - P/E Multiple|CCRD - P/E Multiple|PMTS (CPI Card Group) - Price to Earnings Ratio|Price to Earnings Multiple TROO|Price to Earnings Ratio CURRENC Group Inc|XBP Europe Holdings Inc. - Market Cap to Net Income|Price to Earnings Ratio PSQ Holdings, Inc. (PSQH)|FNGR: Market Cap to Net Income|P/E Multiple SURG (SurgePays)|P/E Multiple Usio Inc USIO|NUKK: Price to Earnings Ratio|Market Cap to Earnings The OLB Group, Inc.|Future FinTech Group Inc. (FTFT) - Price to Earnings Ratio|Price to Earnings Ratio DigiAsia|APCX (AppTech Payments Corp) - P/E Multiple|Market Cap to Earnings BM Technologies Inc. BMTX|Price to Earnings Ratio Global Blue Group (GB)|Nuvei Technologies - Price to Earnings Multiple|Block, Inc. - Price to Earnings Ratio