Brink's Company (BCO): Market Cap to Revenue Ratio

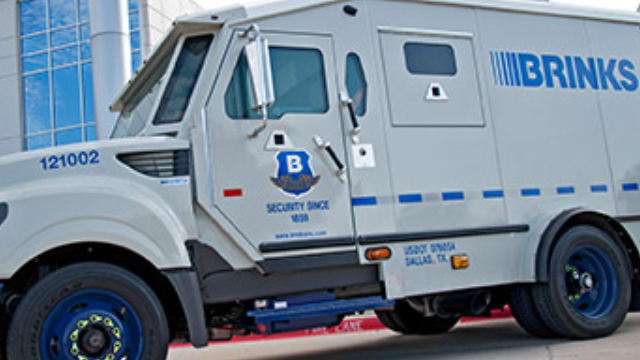
Brandmark of Brink's Incorporated (BCO)

The revenue valuation of The Brink's Company (BCO) reflects the dynamics of a global leader in secure logistics, with the metric holding at 0.90. Stability is driven by diversification through the support of the banking and retail sectors. Capitalization growth is based on the implementation of smart safes and software robots that automate cash accounting, transforming the traditional cash management model into a digital format.

Price-to-Revenue Ratio: Brink's (BCO) for 07/04/2022 - 11/15/2026

Analytical breakdowns for brinks.com (BCO)
- price and consensus price forecast:
- stock exchange capitalization data:
Fundamental company analysis:BCO - Brink's Incorporated
Finished products of The Brink's Company

The Brink's Company (BCO) maintains revenue stability based on the critical importance of valuables logistics and ATM services, making the historical P/S ratio a reliable tool for assessing market confidence in these operations. This ratio compares market capitalization to annual sales, allowing investors to determine whether they are overpaying for business revenue relative to industry standards and the fundamental value of assets.

Competitors of The Brink's Company

Price-to-Revenue Ratio MSI (Motorola Solutions)|Price-to-Revenue Ratio Axon Enterprise, Inc. AXON|Market Capitalization-to-Revenue Ratio ROL|ALLE - Price-to-Revenue Ratio|Price-to-Sales Ratio APG|Underwriters Laboratories (ULS) - Price-to-Revenue Ratio|Market Cap to Revenue Life360 Corp|Market Cap to Revenue ADT|Price to Sales Honeywell Home REZI|P/S Multiple YOU|Price-to-Revenue Coefficient OSI Systems|Crane NXT Corp - Market Cap to Revenue|Perimeter Solutions Corp - Price-to-Revenue Ratio|GEO: Market Cap to Revenue|ALRM: Price-to-Revenue Ratio|CXW: P/S Multiple|Price to Sales Napco Security Technologies, Inc. (NSSC)|EVLV (evolvtechnology.com) - P/S Multiple|ITRN (Ituran Location and Control) - Market Cap to Sales Volume|Price-to-Revenue Ratio gorilla-technology.com (GRRR)|Price-to-Revenue Coefficient Mistras Group Inc.|P/S Multiple CIX (CompX)|AISP (Airship AI) - Price-to-Sales Ratio|SSTI: Market Cap to Revenue|Market Capitalization-to-Revenue Ratio DUOT (Duos Technologies)|GNSS: P/S Multiple|SNT - Price-to-Revenue Coefficient|Price-to-Revenue Ratio Bridger Aerospace Group|Price to Sales Identiv INVE|P/S Multiple CIGL|P/S Multiple Odysight.ai (ODYS)|P/S Multiple KSCP (Knightscope Inc.)|RECT: Market Cap to Revenue Ratio|SPCB: Market Cap to Revenue|CSAI - P/S Multiple|GFAI: P/S Multiple|Price to Sales SenesTech Corp (SNES)|Market Cap to Revenue DTSS|Market Cap to Revenue Universal Security Instruments (UUU)|P/S Multiple ILAG|Market Cap to Sales Volume SUGP|P/S Multiple AREB (American Rebel)|SOBR Safe Inc - Price-to-Revenue Ratio|iveda.com - P/S Multiple|DGLY (Digital Ally Corp) - Market Cap to Revenue Ratio|LGMK: P/S Multiple|Everbridge, Inc. - Market Capitalization-to-Revenue Ratio