bench.com (BHE) - Cash per Single Share

Investments in high-cost equipment and sterile cleanrooms drive the capitalization of Benchmark Electronics (BHE). Fluctuations in cash per share confirm asset movement, where the metric level stands at 8.16. Low margin risks and dependence on Asia constrain growth, yet strict FAA and FDA oversight, combined with deep integration into medtech, ensure exceptional B2B customer loyalty.

Comprehensive metric breakdowns and analytics for Benchmark Electronics Inc (BHE)
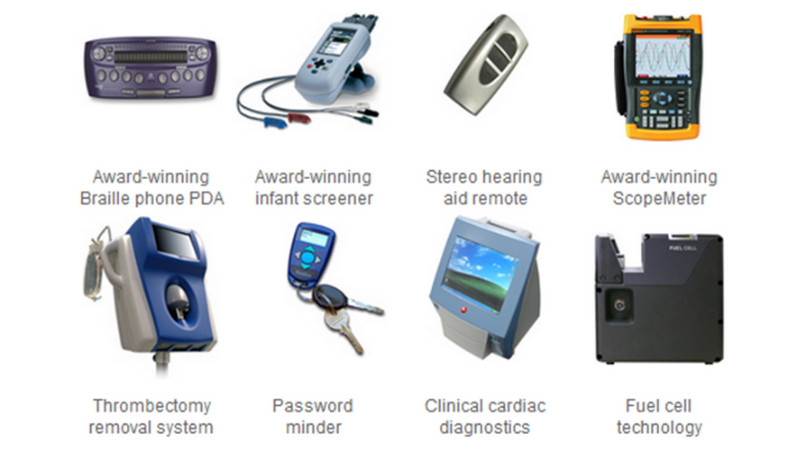
Conservative capital demands absolute liquidity transparency to assess business resilience against external shocks. This indicator measures net cash per share, determining the balance between financial security and capital efficiency. For Benchmark Electronics (BHE), this reserve is critical for retaining highly skilled engineering staff, which is clearly reflected in the cash cushion per share.
