Broadridge Financial Solutions, Inc. (BR) - Price to Earnings Ratio

Corporate emblem and logo of Broadridge Financial Solutions (BR)

Broadridge Financial is developing a digital ecosystem for brokers by investing in blockchain and AI. The company's historical average P/E reflects the valuation dynamics of these technologies, where the parameter is 20.50. Efficiency is being enhanced through cloud-based reporting outsourcing, while business resilience is guaranteed by a unique workforce and minimal turnover among key engineers.

Broadridge Financial Solutions, Inc. (BR) - Price to Earnings Ratio from 07/04/2022 to 11/12/2026
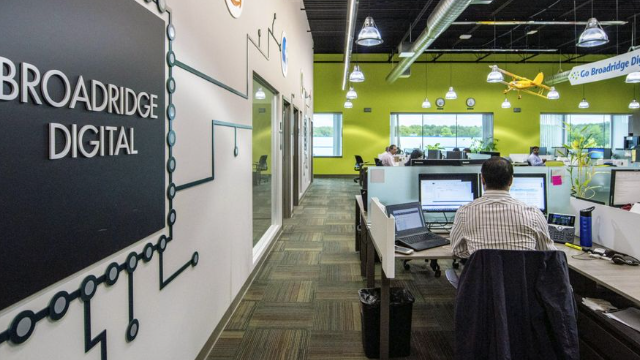
Core merchandise of broadridge.com

The P/E ratio determines the market value of a single unit of net income, measuring the investment payback period assuming constant earnings. This metric reacts sharply to quarterly reports, reflecting market expectations regarding business growth rates. By analyzing the relative P/E valuation of a company, an investor can identify speculative overheating of the asset. For Broadridge (BR), this indicator is critical, as trading volume volatility and industry consolidation directly impact the fundamental value of the shares.

Key competitors

Market Cap to Earnings spglobal.com SPGI|P/E Multiple HOOD|Price to Earnings Ratio ICE (intercontinentalexchange.com)|Price to Earnings Ratio CME Group CME|Company Value to Net Income MCO|NDAQ - Price to Earnings Ratio|Market Cap to Earnings MSCI Inc.|IBKR: P/E Multiple|LPL Financial Holdings Inc. (LPLA) - P/E Multiple|CBOE (Cboe Options Exchange) - P/E Multiple|Price to Earnings Multiple NMR (Nomura Group)|Price to Earnings Ratio Futu Holdings (FUTU)|EVR (evercore.com) - Company Value to Net Income|P/E Multiple FRHC (Freedom Holding Corp.)|Business Payback Period MarketAxess Holdings Inc. (MKTX)|PennyMac Financial - P/E Multiple|BULL (Webull Financial LLC) - Price to Earnings Multiple|GLXY: P/E Multiple|Market Cap to Net Income Ratio clearwater-analytics.com CWAN|LAZ (Lazard) - P/E Multiple|Market Cap to Earnings StoneX Group SNEX|Price to Earnings Ratio BGC (BGC Group Inc)|ETOR (eToro Platform) - Company Value to Net Income|P/E Multiple MIAX (Miami International Holdings, Inc.)|MRX (marex.com) - Market Cap to Net Income|Perella Weinberg Partners Corp - P/E Multiple|Business Payback Period Donnelley Financial Solutions DFIN|Solowin Financial (SWIN) - Price to Earnings Ratio|Price to Earnings Multiple WTF|MKTW (MarketWise Inc.) - P/E Multiple|P/E Multiple m-finance.com|Price to Earnings Ratio Aether Holdings Inc (ATHR)|netsoltech.com - Price to Earnings Multiple|P/E Multiple AMTD (AMTD IDEA)|MOGO - Price to Earnings Ratio|MDB Capital - P/E Multiple|Business Payback Period wentworthms.com BCG|BLBX: P/E Multiple|MMTec (MTC) - P/E Multiple|Price to Earnings Ratio Magic Empire Global Ltd|Price to Earnings Ratio ZBAI|P/E Multiple GSIW|Price to Earnings Ratio BENF (trustben.com)|Price to Earnings Ratio Lion Group Holding Ltd. LGHL|Company Value to Net Income PLUT|ATIF Group - P/E Multiple|Market Cap to Earnings Enfusion, Inc.|HPH (puyiwm.com) - Price to Earnings Ratio