Bridgford Foods Corp (BRID) - Market Value to Book Value Ratio
BRID (Bridgford Foods Corp) - company brandmark

Bridgford Foods (BRID) relies on stable demand from US restaurants and retailers within the frozen appetizer segment. However, expansion is hindered by the high cost of plants and fierce competition for shelf space, with the key metric standing at 0.45. The historical price chart below illustrates the performance of the company as it implements robotics to optimize packaging and reduce personnel costs.

Bridgford Foods (BRID) - Market-to-Book Ratio from 07/04/2022 to 10/30/2026
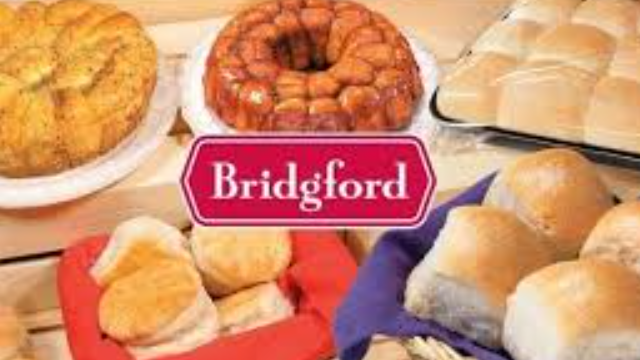
Flagship merchandise of Bridgford

The market-to-book ratio measures the premium of the stock price over the value of net assets. By analyzing the current ratio of company value to its book value, an investor assesses the market's interpretation of tangible resources. An increase in this multiple reflects the inflationary revaluation of assets, although an excessive gap raises the risk of a correction as borrowing costs rise. For Bridgford Foods (BRID), this premium is justified by strong distribution and brand recognition. Stable demand for products supports a high business valuation relative to its tangible asset base.

Competing companies

KHC: Market Capitalization to Book Value Ratio|Capitalization to Book Value Ratio K|Market Value to Book Value Ratio General Mills|McCormick & Company, Incorporated (MKC) - Market Capitalization to Book Value|Market Capitalization to Book Value Ratio JBS|HRL - Market-to-Book Ratio|Market Value to Book Value Ratio The J. M. Smucker Company SJM|PPC - Market Cap to Net Assets Ratio|Campbell's - Market Capitalization to Book Value Ratio|Market Capitalization to Book Value Smithfield SFD|INGR (Ingredion Corp) - Market Cap to Net Assets Ratio|Market Value to Equity Ratio Lamb Weston Holdings, Inc. LW|BRFS (BRF S.A.) - Market Capitalization to Book Value Ratio|postholdings.com - Market Capitalization to Net Assets|Market Capitalization to Book Value Ratio MZTI|Market Capitalization to Book Value Premier Protein|Market Value to Book Value Ratio Tootsie Roll Industries Inc TR|FLO: Capitalization to Book Value Ratio|The Simply Good Foods Company - Market Capitalization to Book Value Ratio|Market Capitalization to Book Value nomadfoods.com NOMD|WK Kellogg (KLG) - Market Value to Book Value Ratio|JJSF - Market Capitalization to Book Value|UTZ (Utz Quality Foods) - Market Capitalization to Book Value Ratio|THS: Market Value to Book Value|Market Capitalization to Book Value Ratio STKL|JBSS - Market-to-Book Ratio|Market Capitalization to Book Value Ratio SENEA (Seneca Foods Corporation)|LWAY: Capitalization to Book Value Ratio|MAMA: Market Cap to Net Assets Ratio|Market Value to Book Value BGS (B&G Foods Holding)|BYND: Market Capitalization to Book Value Ratio|Market Capitalization to Net Assets HAIN (hain.com)|Market Value to Book Value Ratio Wing Yip Food Holdings Group|Market-to-Book Ratio Laird Superfood Inc. LSF|Market Value to Book Value Ratio Borealis Foods Inc. (BRLS)|FARM - Market-to-Book Ratio|Market Capitalization to Book Value Ratio BOF (BranchOut Food)|PFAI: Capitalization to Book Value Ratio|Sow Good, Inc. - Market Capitalization to Book Value Ratio|TWG: Market Value to Book Value Ratio|MeaTech 3D (STKH) - Market Value to Book Value Ratio|Blue Star Foods Corp. - Market Value to Book Value|FREE (Whole Earth Brands Inc.) - Market Capitalization to Book Value Ratio|lancastercolony.com (LANC) - Market Capitalization to Book Value|Market Capitalization to Book Value Ratio RGF|Stryve Foods Inc. - Capitalization to Book Value Ratio|Market Capitalization to Book Value Ratio SOVO (Sovos)