BTU Peabody Company Assets

Peabody Energy (BTU) price action relies on demand in Asia and the US coupled with low costs. The company's total assets reflect its current market position, where 5604.29 represents the latest level. Profit growth is driven by the substitution of global fuel exports during the crisis. Simultaneously, the business is implementing autonomous transport and mine automation to reduce environmental impact.

Analytical breakdowns and data insights for company Peabody Energy Corp (BTU)
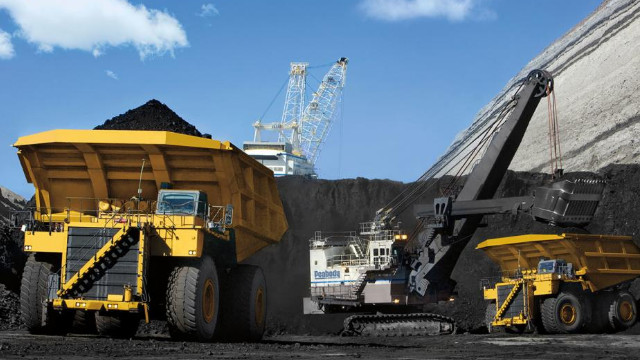
Peabody Energy (BTU) focuses on optimizing thermal mines and developing its metallurgical segment to maximize cash flows. A reverse calculation of total asset value via return on assets (ROA) allows for the filtering of one-off market noise; therefore, a steady increase in the valuation of total assets confirms a strengthening fundamental base, whereas sharp spikes signal a rise in tail risks.