Webull Corporation (BULL) Cash on Hand per Share

Amidst fierce competition for traders, Webull Corporation (BULL) is betting on advanced analytics. The cash per share metric visualizes the company's liquidity, where the 3.58 level reflects the current amount. Cloud outsourcing ensures trading efficiency, while expansion is based on the acquisition of foreign licenses and the implementation of crypto services.

Analytical breakdowns for Webull Corporation
- stock value and consensus price forecast:
- market capitalization details:
- book value of equity indicators:
- company liabilities and liquidity data:
Debt to Capital Webull Corporation|BULL - Long-Term Debt to Equity|Ratio of Short-Term Indebtedness to Capital Webull|BULL - Company Aggregate Debts|Debts to Book Capitalization Webull Financial LLC|BULL - Company Long-Term Liabilities|Amount of Current Liabilities Webull|Interim Coverage Ratio webull.com
- earnings and valuation multiples indicators:
BULL - Company Net Income|Expected Net Profit Webull Corporation|BULL - Price to Earnings Ratio|Price to Future Earnings Ratio Webull Corporation|BULL - PEG Multiple|Enterprise Value to Earnings Before Interest, Taxes, Depreciation and Amortization Webull Financial LLC|BULL - Operating profit before deduction of amortization|Net earnings per share (EPS TTM) Webull|BULL - Earnings per share for the last twelve months|Year-over-year earnings per share growth for the last twelve months webull.com|BULL - Earnings per share growth in current year|Net earnings per share growth forecast for next year Webull Corporation
- sales volume and revenue indicators:
- margin indicators:
- cash availability and cash flow indicators:
Summary company analysis:BULL, Webull Corporation
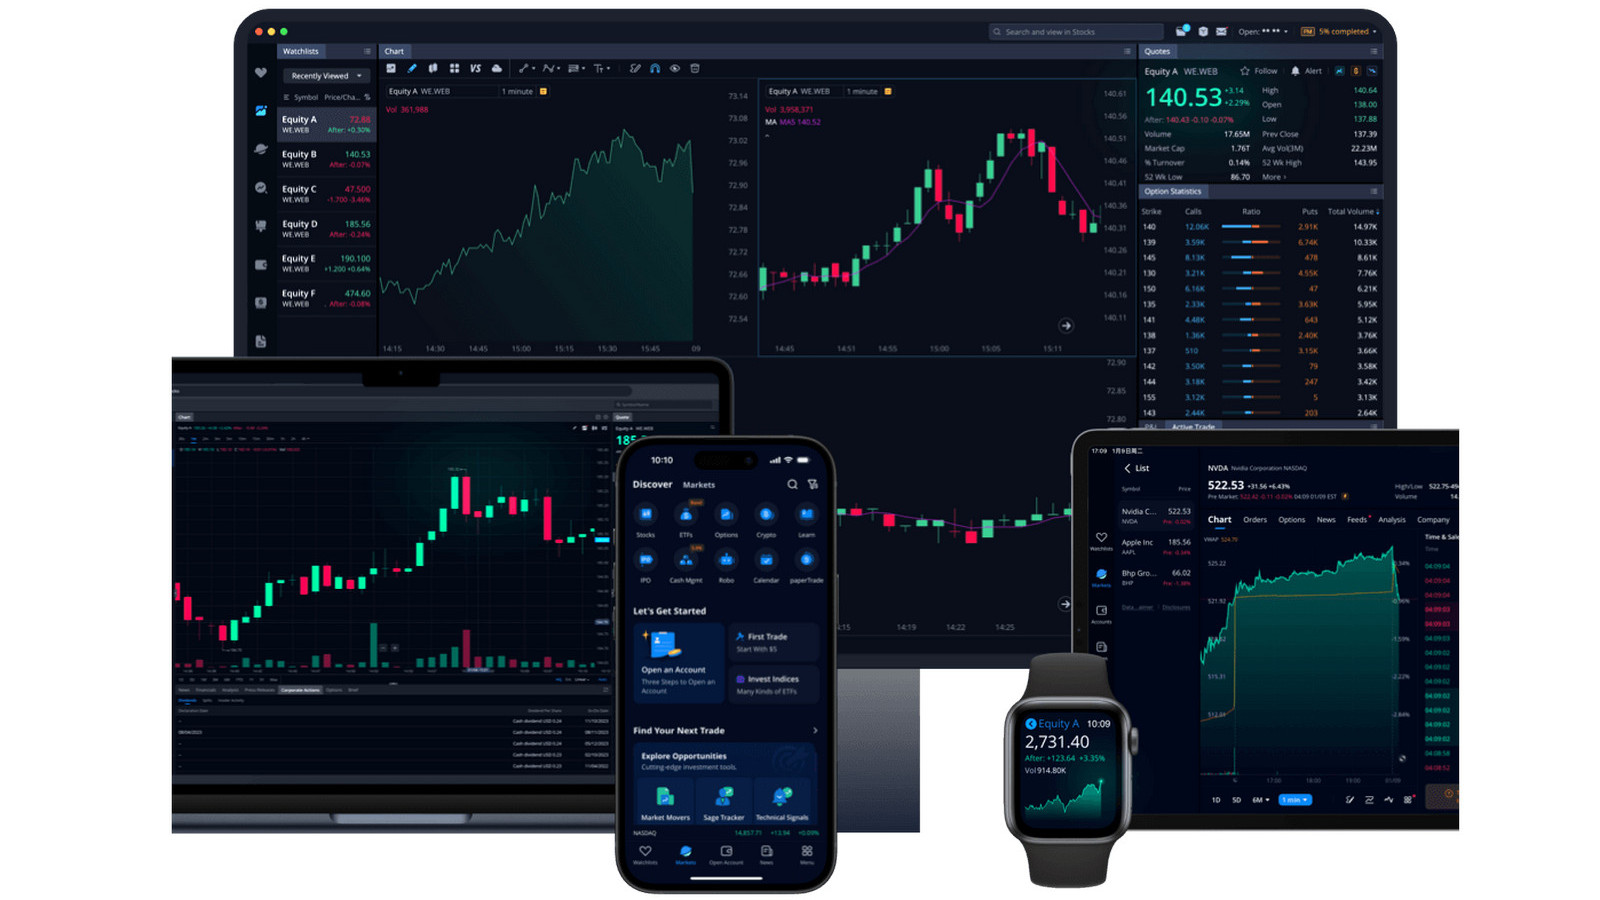
Webull Corporation is scaling its asset ecosystem through a technological symbiosis with global exchanges and market makers. An analysis of the current cash per share allows for an assessment of the liquid capital attributable to a single security, which determines the broker's resilience to market shocks and the balance between financial security and resource efficiency.
Competing companies
Cash Funds per Share SPGI|Cash per Share HOOD|Cash Funds Calculated per Share Intercontinental Exchange Inc.|Cash per Share CME (cmegroup.com)|MCO (Moody's Investors Service) - Cash Money per Share|NDAQ: Cash per Single Share|Cash Funds Calculated per Share msci.com MSCI|Broadridge (BR) - Cash Funds per Share|Interactive Brokers LLC - Amount of Cash per Share|Cash Funds per Share LPL Financial|Cash per Single Share Cboe (CBOE)|Cash Funds per Share Nomura Group (NMR)|FUTU: Cash Money per Share|Cash Funds per Share Evercore Inc. EVR|Cash Funds Volume per Share Freedom Holding|MarketAxess Corp - Cash per Share|Cash Funds Calculated per Share PennyMac PFSI|Galaxy Digital Inc (GLXY) - Cash Funds per Share|CWAN: Cash Calculated per Single Share|LAZ (Lazard Group) - Cash per Share|stonex.com (SNEX) - Cash Funds Calculated per Share|Cash per Share BGC|ETOR (eToro) - Amount of Cash per Share|Miami International Holdings - Cash per Single Share|MRX - Cash per Single Share|PWP - Cash Funds per Share|Cash Funds Calculated per Share Donnelley Financial Solutions, Inc. DFIN|SWIN (Solowin Financial) - Cash per Single Share|Cash on Hand per Share Waton Financial Ltd (WTF)|MKTW (marketwise.com) - Cash per Share|Cash Funds per Single Share MFI (m-Finance)|Cash per Share ATHR|NTWK - Cash on Hand per Share|Cash Funds per Share amtdinc.com AMTD|Mogo Financial (MOGO) - Cash on Hand per Share|MDBH: Cash per Single Share|Cash Funds Volume per Share Binah Capital Group, Inc (BCG)|BLBX: Cash per Share|MTC - Cash Funds Calculated per Share|MEGL (Giraffe Capital) - Cash per Share|ZBAI - Cash Funds Volume per Share|Cash per Share GSIW|Cash Funds Calculated per Share Beneficient Corp|Cash per Share LGHL (Lion Group Holding Ltd)|Amount of Cash per Share PLUT|ATIF - Cash Funds per Share|Cash Funds Calculated per Share Enfusion ENFN|HPH: Cash per Share
