CAMT Camtek Ltd Year-over-year net earnings per share growth for the last 12 months

The quarterly EPS growth rate on the precise GURU.Markets chart, where the metric level is 171.30, confirms full capacity utilization and the expansion of Camtek Ltd. (CAMT) optical system assembly plants. The business is scaling effectively by supplying unique, high-margin chip controllers. Competent Israeli management ensures order transparency while maintaining a monopoly in its niche.

Camtek Semiconductors (CAMT) - metric breakdowns and financial figures
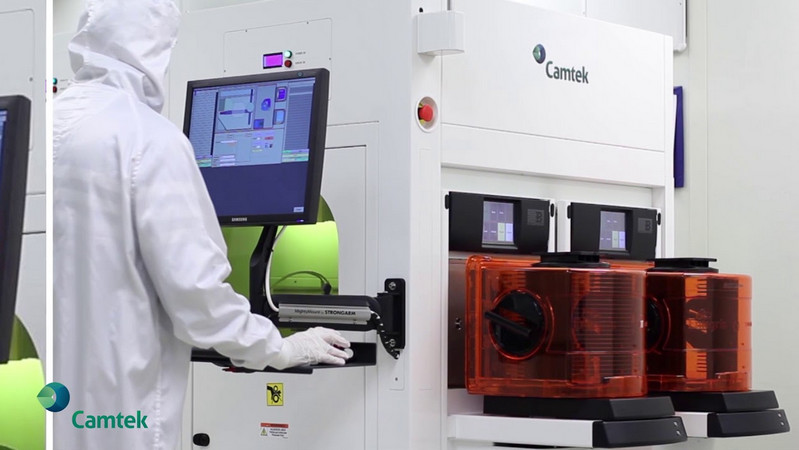
To minimize investment risks, it is necessary to evaluate the dynamics of net income per share. This indicator mathematically compares current quarterly earnings with similar past periods to identify trends. By analyzing the quarterly EPS growth vector, an investor determines the sustainability of business scaling rates. For Camtek Ltd. (CAMT), this metric reflects market demand for high-precision metrology systems. Growth in this indicator confirms the sales effectiveness of equipment for semiconductor defect control.
