Casey's (CASY): Stock Price

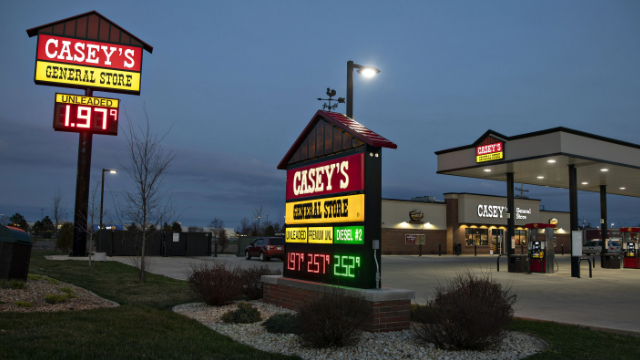
The price trend shown below illustrates the dynamics of Casey's General Stores (CASY), which is expanding its network through the acquisition of new locations, becoming the primary trading hub for rural residents of the Midwest. Casey's General Stores (CASY) generates revenue from fuel and grocery retail, with the 713.17 metric confirming the efficiency of the model. Combining gas stations with full-service cafes creates a unique consumption habit, granting the brand the status of a local convenience monopolist.

Financial and market metric breakdowns for Casey's General Stores, Inc. (CASY)
Casey's General Stores (CASY) is developing a retail model by outsourcing the production of its private labels to external factories under strict quality control. This market value trajectory consolidates daily closing prices into a single line. The price reflects the final investor consensus, filtering out intraday volatility. Peak values confirm success but may indicate that the asset is overbought. This allows for an assessment of the business's resilience against vendor dependency.
