Check-Cap Ltd - CHEK Net earnings per share (EPS TTM)

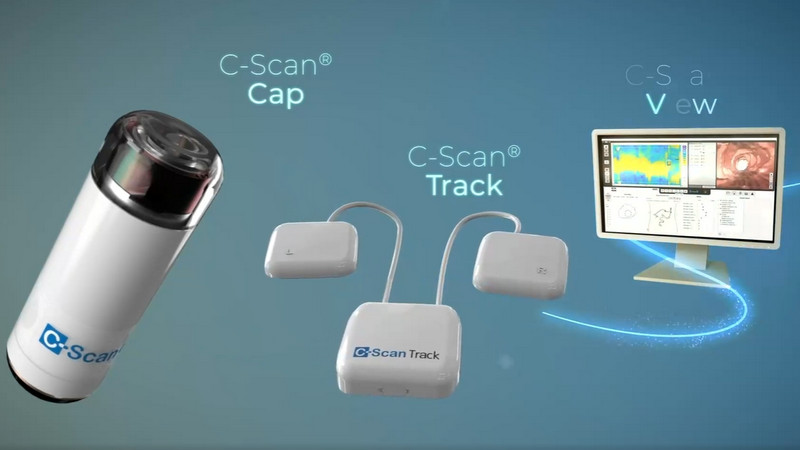
Check-Cap Ltd. demonstrates stability regardless of economic conditions, yet faces stringent FDA oversight and patent barriers. The TTM YoY earnings per share trend on the GURU.Markets chart currently stands at 0.00, indicating the current balance of power. Check-Cap Ltd. is implementing C-Scan, aiming to replace invasive colorectal cancer diagnostic methods with non-contact X-ray scanning.

Check-Cap Medical - analytical breakdowns and key metrics (CHEK)
This indicator measures the dynamics of the rolling annual earnings per share, promptly reflecting changes in profitability and currency fluctuations through growth rates. Extremes on the net income per share YoY ttm growth rate chart signal trend reversals: peaks often foreshadow stagnation, while troughs indicate a potential rebound. For Check-Cap Ltd. (CHEK), this metric reflects the financial efficiency of implementing innovative capsules for non-invasive diagnostics.
