CIEN Ciena Corp.: Net earnings per share (EPS TTM)
The rolling 12-month EPS chart illustrates the profit dynamics of Ciena Corporation (CIEN), where 4.48 serves as the current parameter value. Gary Smith focuses on leadership in optical technologies, effectively managing demand. The business relies on cyclical investments in 5G and AI, while stable liquidity and network modernization offset temporary fluctuations in customer inventories.

Summary analytical data breakdowns for Ciena Corporation (CIEN)
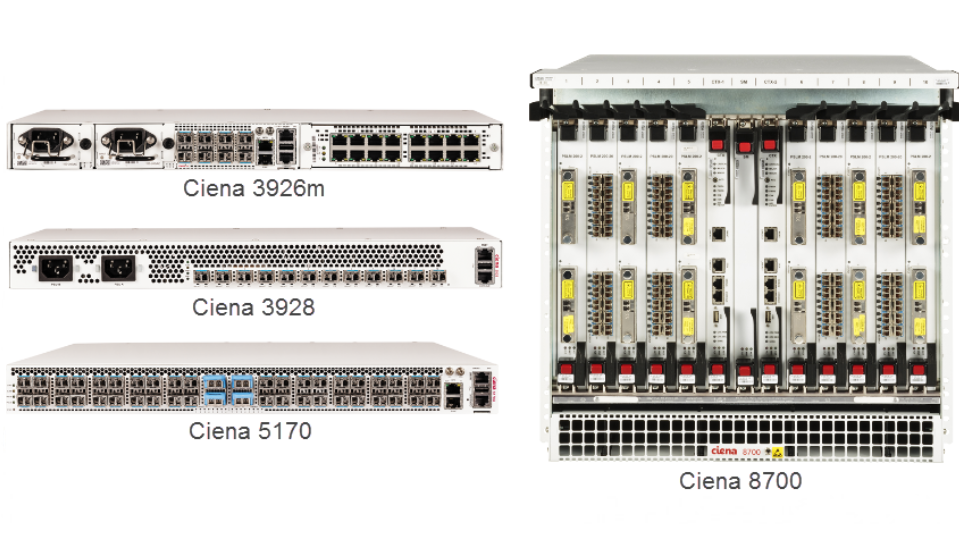
Trailing twelve-month earnings per share (EPS TTM) determines the actual share of equity in annual income, neutralizing the impact of one-off transactions and volatility. By analyzing the rolling 12-month EPS chart, an investor assesses the business resilience of Ciena Corporation (CIEN), whose ability to generate profit depends directly on the implementation of energy-efficient optical solutions amid global growth in internet traffic.
