CLS Celestica Inc: Net earnings per share for the last 12 months

Celestica Inc. retains major customers through the complexity of its manufacturing processes, creating a stable order flow. The rolling annual earnings per share snapshot confirms this trend, where the parameter value reaches 10.51. However, a lack of pricing power forces the company to rely on massive assembly volumes, balancing on minimal margins under pressure from corporate behemoths.

Financial and market metric breakdowns for Celestica Inc. (CLS)
- stock price and consensus target price:
- company stock capitalization data:
- balance sheet net asset value indicators:
- debt obligations and liquidity statistics:
- earnings and multiples data:
CLS - Net Income|Future Profit Celestica Inc.|CLS - Market Price to Net Income Ratio|Projected Price to Earnings Celestica Inc|CLS - PEG Multiple|Enterprise Value to Earnings Before Interest, Taxes, Depreciation and Amortization Celestica Corporation|CLS - Income before deduction of interest, taxes and amortization|Net earnings per share (EPS TTM) Celestica|CLS - Net earnings per share for the last four quarters|Year-over-year earnings per share growth for the last twelve months celestica.com|CLS - Earnings per share growth this year|Earnings growth forecast for next year Celestica Inc.
- revenue and sales details:
Analysis of all company metrics:Celestica Inc. (CLS)
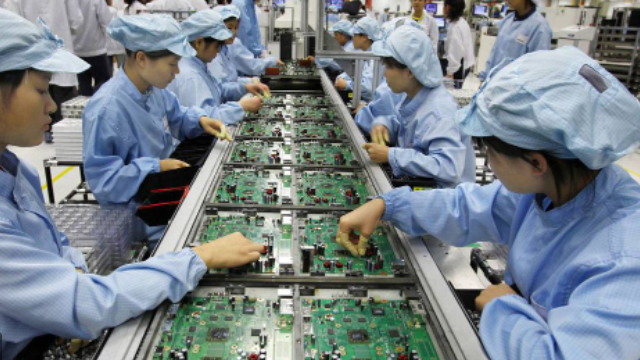
To filter for high-quality assets, investors utilize EPS TTM as the benchmark for profit generation efficiency per security. This TTM earnings per share snapshot reflects the actual return on equity, which for Celestica Inc. (CLS) is sustained through global supply diversification, minimizing logistical risks and stabilizing the business's final margins.
Key competitors
Taiwan Semiconductor Manufacturing Company - Net earnings per share (EPS TTM)|Advanced Semiconductor Engineering (ASX) - Net earnings per share for the last 12 months|JBL (Jabil Circuit) - Net earnings per share for the last 12 months|Net earnings per share for the last 12 months Flex Ltd.|Earnings per share for the last twelve months globalfoundries.com|Net earnings per share for the last 12 months United Microelectronics (UMC)|Earnings per share for the last twelve months Fabrinet Corporation (FN)|Net earnings per share for the last 12 months Tower Semiconductor Ltd. TSEM|Net earnings per share (EPS TTM) AMKR (Amkor)|Net earnings per share (EPS TTM) Sanmina Corp. SANM|PLXS - Earnings per share for the last twelve months|BHE - Net earnings per share (EPS TTM)|KE: Net earnings per share (EPS TTM)|ChipMOS TECHNOLOGIES (Bermuda) LTD. (IMOS) - Net earnings per share (EPS TTM)|SKYT (SkyWater Technology, Inc.) - Net earnings per share (EPS TTM)|Eltek Ltd. - Earnings per one share for the last 12 months|Net earnings per share (EPS TTM) KTCC|Net earnings per share (EPS TTM) K-Tech Solutions (KMRK)|Net earnings per share (EPS TTM) NSYS (Nortech Systems)|SGMA - Net earnings per share for the last 12 months
