CMG: chipotle.com PEG Multiple
Corporate company logo of Chipotle Corp (CMG)

Chipotle Mexican Grill (CMG) is aggressively expanding its network by implementing profitable digital sales channels and preparing for entry into global markets. The P/E ratio relative to growth expectations demonstrates operational yield dynamics, where 2.78 indicates the value of this parameter. Profit growth is driven by digitalization without franchising costs, while business resilience is bolstered by sustainable sourcing and strict adherence to social labor standards.

CMG - Chipotle Mexican Grill PEG Multiple over the range 07/04/2022 - 11/13/2026

Analytical breakdowns for Chipotle Mexican Grill (CMG)
Fundamental company analysis:Chipotle Mexican Grill, Inc. (CMG)
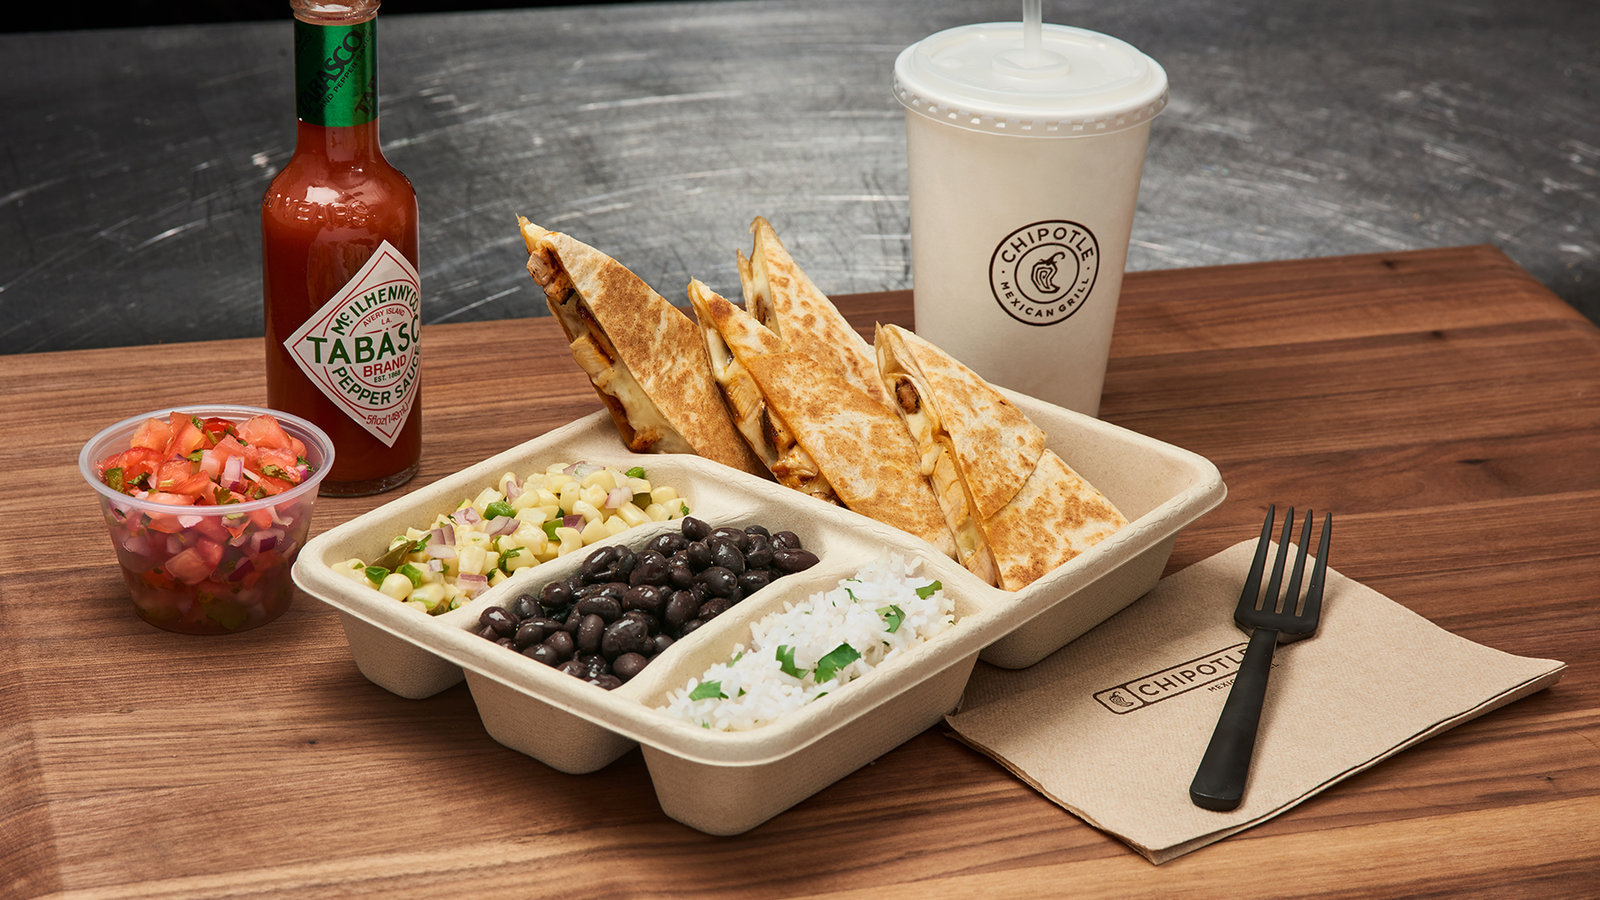
Finished products of Chipotle

For Chipotle Mexican Grill (CMG), the fast-casual format ensures profit resilience even during declines in consumer activity, making the analysis of growth dynamics key to assessing business value. This ratio correlates the current P/E with earnings growth rates; by utilizing a growth-based undervaluation assessment, an investor determines price fairness, where values below one signal that the asset is undervalued relative to its expansion.

Competing companies

Price/Earnings to Growth Multiple McDonalds MCD|PEG Multiple SBUX (Starbucks Corp)|PEG Multiple Yum Brands Inc YUM|SYY: Price/Earnings to Growth Multiple|rbi.com - Company Value to Earnings Growth Ratio|DRI: PEG Multiple|Price to Earnings Adjusted for Growth Rate Toast Inc (TOST)|Price/Earnings to Growth Ratio US Foods Holding|YUMC: Growth-Adjusted Payback Ratio|PEG Multiple DPZ|Growth-Adjusted Market Cap to Net Income texasroadhouse.com|Price/Earnings to Growth Ratio Aramark Corporation ARMK|BROS: Growth-Adjusted P/E Ratio|Cava Grill - PEG Multiple|Price to Net Income Growth Ratio Wingstop Corp (WING)|MIDD: PEG Multiple|Price/Earnings to Growth Multiple brinker.com|SHAK (Shake Shack) - PEG Multiple|CAKE: Growth-Adjusted Payback Ratio|PEG Multiple WEN|Growth-Adjusted Market Cap to Net Income Olo Corp|Price/Earnings to Growth Ratio Papa John's International PZZA|ARCO (arcosdorados.com) - Market Cap to Earnings and Growth Ratio|BRCB - Price/Earnings to Growth Ratio|Price to Earnings Adjusted for Growth Rate Haidilao Overseas|CBRL (Cracker Barrel Corp) - Price/Earnings to Growth Multiple|SG: Company Value to Earnings Growth Ratio|Price/Earnings to Growth Ratio First Watch Corp|Price/Earnings to Growth Ratio BH|PEG Multiple KRUS|PLAY - Price to Earnings Adjusted for Growth Rate|BJ's Restaurant & Brewhouse - Price/Earnings to Growth Multiple|Growth-Adjusted Payback Ratio BLMN|DNUT - Price/Earnings to Growth Ratio|potbelly.com (PBPB) - Price/Earnings to Growth Multiple|KRT: PEG Multiple|Price to Earnings Adjusted for Growth Rate Portillo's Hot Dogs (PTLO)|Price/Earnings to Growth Multiple DIN|Growth-Adjusted P/E Ratio JACK (Jack in the Box Restaurants)|PEG Multiple LOCO|Growth-Adjusted Market Cap to Net Income dennys.com|PEG Multiple TWNP (Twin Hospitality Group)|MB - Price/Earnings to Growth Multiple|Red Robin Gourmet Burgers Inc. - PEG Multiple|GENK - PEG Multiple|The ONE Group Hospitality (STKS) - Price/Earnings to Growth Ratio|Growth-Adjusted P/E Ratio BDL|Price/Earnings to Growth Multiple RAVE|FAT: Growth-Adjusted Payback Ratio|PEG Multiple GIFT|Noodles & Company Inc. (NDLS) - Price to Net Income Growth Ratio|Price/Earnings to Growth Ratio Ark Restaurants ARKR|Growth-Adjusted Payback Ratio VSTD|Li Bang - PEG Multiple|Growth-Adjusted Market Cap to Net Income HWH International Inc HWH|Good Times Burgers (GTIM) - Price/Earnings to Growth Ratio|PC (Premium Catering Ltd) - Price/Earnings to Growth Ratio|Price/Earnings to Growth Ratio BT Brands, Inc.|Price/Earnings to Growth Ratio HCHL|PEG Multiple BFI|Price/Earnings to Growth Multiple Chuy's Holdings CHUY|Price/Earnings to Growth Ratio Sushi Ginza Onodera Inc ONDR|PNST - Price/Earnings to Growth Multiple|Presto Automation Inc. - PEG Multiple|Price to Net Income Growth Ratio Yoshiharu Global Co. (YOSH)|Twin Hospitality Group Inc. (TWNPV) - Price/Earnings to Growth Ratio