Conifer Holdings, Inc (CNFR) - Net Sales Margin
Conifer Holdings Inc. - graphic logo of issuer CNFR

Conifer Holdings, Inc. (CNFR) is implementing digital scoring and payment automation to reduce costs. This net sales margin chart confirms the effectiveness of these measures, where the 48.30 parameter determines the metric's magnitude. However, strict oversight and capital requirements create barriers to growth, while falling underwriting profit signals a decline in the company's cash flows.

Conifer Holdings Inc (CNFR) - Net Profit Margin from 07/04/2022 to 09/30/2025

Conifer Holdings, Inc. (CNFR) - metric breakdowns and financial figures
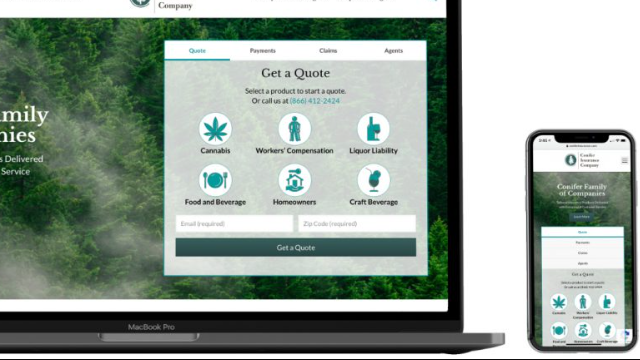
- market value and analyst target forecast:
- cash availability and cash flow indicators:
Summary company analytics:Conifer Holdings - CNFR
Manufactured product of Conifer Holdings Inc

Sales margins determine the efficiency of converting revenue into net profit. This metric measures the share of residual income after deducting all operating and tax expenses. By analyzing net profit margins, an investor can observe operational efficiency trends without quarterly gaps. For Conifer Holdings, Inc. (CNFR), such a metric confirms a financial recovery. The stable trend here reflects the successful stabilization of the insurer's image within the specialty market.

Who Conifer Holdings, Inc. competes with

PGR (Progressive) - Return on Sales by Net Profit|CB (Chubb Insurance) - Net Margin|Return on Sales by Net Profit TRV|Net Sales Margin Allstate Insurance Company|Net Sales Margin AIG|Net Sales Margin thehartford.com (HIG)|Net Sales Margin ACGL (Arch Capital Group Ltd.)|Company Net Profitability BRO (Brown & Brown Insurance)|berkley.com - Net Sales Margin|CINF (Cincinnati Insurance) - Net Return on Sales|Loews Corp (L) - Net Margin|Net Return on Sales CNA|AFG (American Financial Corp) - Net Sales Margin|Return on Sales by Net Profit Kinsale Capital (KNSL)|Net Sales Margin AXS|THG (The Hanover) - Net Profit Rate|Net Sales Margin RLI (rlicorp.com)|Company Sales Margin frontdoorhome.com (FTDR)|SIGI - Net Margin|Company Sales Margin Hagerty HGTY|MCY: Net Sales Margin|Kemper Auto - Net Profit Rate|Net Margin Palomar|HCI: Net Profit Rate|Net Margin Skyward Specialty (SKWD)|SLDE - Net Margin|Net Sales Margin TWFG (TWFG Insurance)|Safety Insurance Group, Inc. (SAFT) - Net Margin|ASIC: Return on Sales by Net Profit|Net Profit Rate BOW (Bowhead Specialty Holdings Inc.)|AMSF: Net Sales Margin|UFG Insurance - Net Profit Rate|HRTG (Heritage Corp) - Net Sales Margin|Net Sales Margin Universal Insurance|Net Sales Margin DGICA|Company Sales Margin American Coastal Insurance Corporation|gbli.com - Return on Sales by Net Profit|NODK (Nodak Insurance Company) - Net Profit Margin|KINS - Net Margin|CCG - Net Sales Margin|UBXG (U-BX Technology Ltd.) - Return on Sales by Net Profit|Net Profit Margin XHG (ir.fenglinju.cn)|Return on Sales by Net Profit FANH|ICCH: Net Profit Rate