Dun & Bradstreet - DNB Price-to-Projected Revenue Ratio

A stable roster of scoring experts and AI engineers has ensured business resilience, as evidenced by the forward P/S dynamics of Dun & Bradstreet (DNB). The current value of 1.70 reflects this status. Dun & Bradstreet (DNB) revenues are based on subscriptions to analytical databases for risk assessment. Technological development relies on autonomous AI platforms that automate the collection of credit profiles, eliminating manual data processing.

DNB (Dun & Bradstreet): analytical breakdowns and indicator data
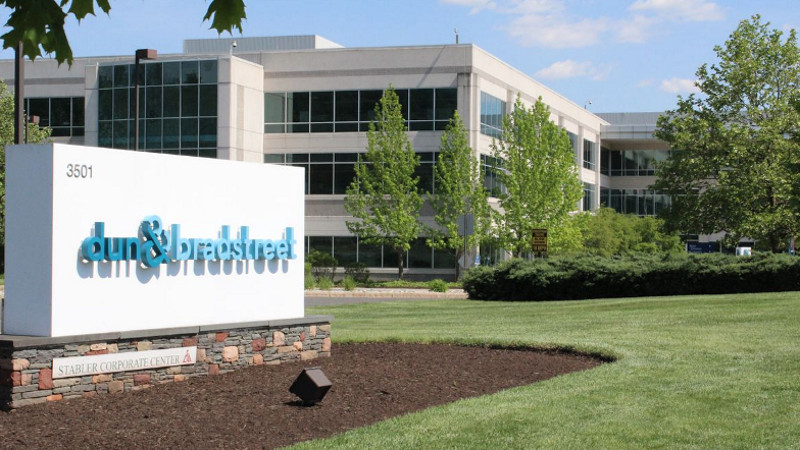
To assess the resilience of Dun & Bradstreet (DNB), it is essential to consider how the market capitalizes its innovations in big data analytics. The current value of 1.70 reflects the ratio of market value to expected revenue for the following year, which allows the forward P/S ratio to determine the degree of business overvaluation relative to its ability to generate future cash flow.
