EDBL Edible Garden: Earnings per share for the trailing year

High entry barriers resulting from the IT platform and strict FDA oversight provide Edible Garden AG (EDBL) with a sustainable market position. The current annual EPS TTM growth rate provided by the GURU.Markets service demonstrates the asset's dynamics, where 86.80 captures the value of this parameter. Efficiency is supported by the automation of greenhouse capacities, while an image as an environmental leader guarantees deep consumer trust.

EDBL (Edible Garden AG): analytical breakdowns and indicator data
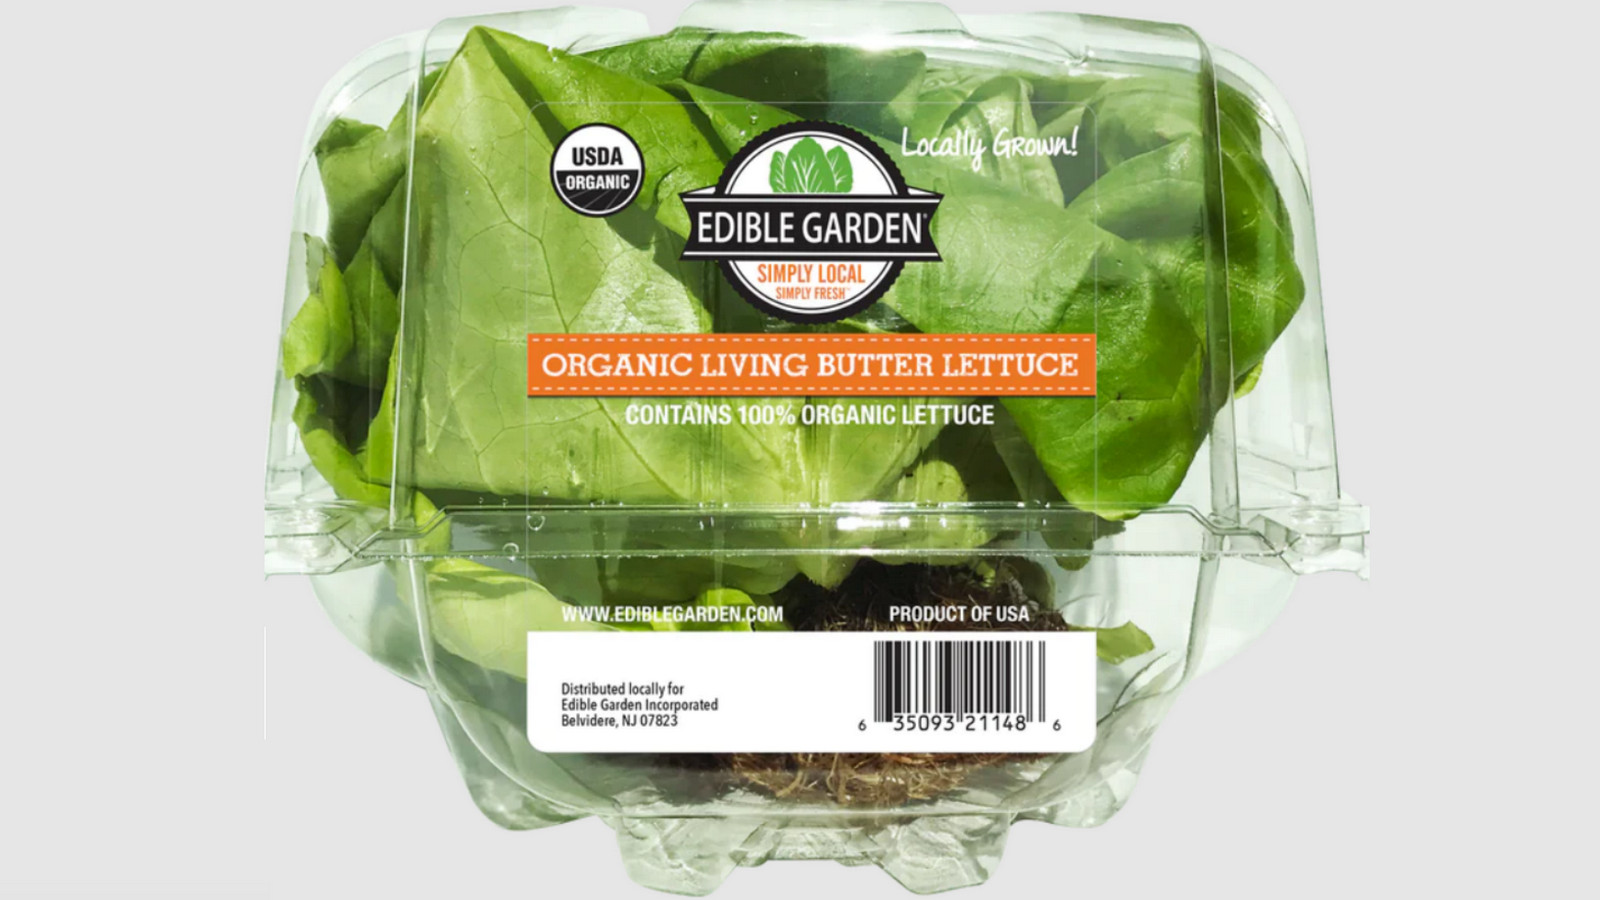
Year-over-year (YoY) EPS growth (TTM) measures the rate of change in net income per share over a rolling twelve-month period. Investors utilize this metric to identify systemic degradation or the hidden potential of an undervalued asset. Analyzing the YoY EPS growth trend over a rolling period allows for an assessment of earnings predictability. For Edible Garden AG (EDBL), this indicator reflects the operational efficiency of its high-tech greenhouses. The localization of production facilities in the US directly impacts the final return on equity.
