ENIC - Enel Chile SA Price to Sales

Symbol and logo of brand Enel Chile Corp (ENIC)

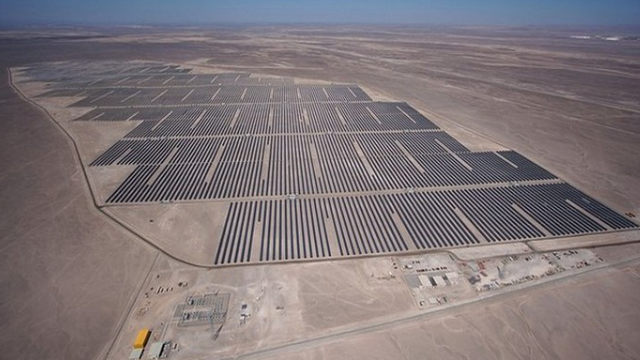
Enel Chile S.A. (ENIC) is aggressively implementing ESG standards, replacing coal-fired capacity with wind and solar farms. The P/S ratio history demonstrates how this transition impacts market valuation. The current level is 1.30, which allows for a real-time assessment of a business relying on large-scale hydropower generation and energy sales. Its status as a decarbonization flagship in Latin America confirms the company's fundamental resilience.

ENIC Enel Chile SA Price-to-Revenue Ratio (07/04/2022 - 11/14/2026)

Metric breakdowns and analytics for Enel Chile Corp (ENIC)
- current price and projected stock value:
- market capitalization statistics:
Summary company analytics:enel.cl, ENIC
Mass-produced product of Enel Group Chile

The ratio of market capitalization to annual revenue determines the value of a single dollar of sales, allowing for an assessment of asset monetization efficiency regardless of debt load. For Enel Chile (ENIC), which dominates the country's energy market, the median P/S reflects a premium for its status as a guaranteed supplier, filtering out market noise and confirming the resilience of the business model through the lens of real demand.

Competing companies

Price-to-Revenue Ratio NEE (nexteraenergy.com)|Southern Company - Market Cap to Revenue|Duke (DUK) - Price to Sales|Vistra Energy - P/S Multiple|Price to Sales National Grid Transco|aep.com (AEP) - Price-to-Revenue Ratio|Market Cap to Revenue Ratio D|EXC (Exelon) - P/S Multiple|Price to Sales Xcel Energy Inc XEL|Price-to-Revenue Ratio Public Service Enterprise Group Inc (PEG)|Price-to-Revenue Ratio ETR (Entergy Inc.)|WEC Energy Group - Market Cap to Revenue|Market Capitalization-to-Revenue Ratio ED|PG&E - P/S Multiple|NRG Energy, Inc. (NRG) - Market Cap to Revenue|DTE: P/S Multiple|Ameren UE - Market Capitalization-to-Revenue Ratio|PPL (PPL Electric Utilities) - P/S Multiple|atmosenergy.com (ATO) - Price-to-Revenue Coefficient|Price-to-Revenue Ratio FirstEnergy (FE)|Price-to-Revenue Ratio CNP (CenterPoint Energy Inc)|P/S Multiple FTS (Fortis Group)|Northeast Utilities (ES) - Price to Sales|EIX: Market Cap to Revenue|Market Capitalization-to-Revenue Ratio CMS (cmsenergy.com)|Talen Energy (TLN) - Price-to-Revenue Ratio|NI - Price-to-Revenue Coefficient|Market Cap to Revenue EBR|Korea Electric Power Corp (KEP) - Price-to-Revenue Coefficient|P/S Multiple EVRG|P/S Multiple alliantenergy.com (LNT)|Emera - Market Cap to Revenue|Price-to-Revenue Coefficient Pinnacle West Capital Corporation (PNW)|AES Energy - P/S Multiple|Price to Sales Oklahoma Gas and Electric|ugicorp.com (UGI) - Price-to-Revenue Ratio|Market Cap to Revenue Ratio IDA|TXNM (TXNM Energy) - P/S Multiple|New Jersey Resources Corp (NJR) - Price-to-Revenue Coefficient|P/S Multiple POR|Market Cap to Revenue Oklahoma Natural Gas OGS|P/S Multiple SR (Spire Inc.)|Algonquin Power & Utilities Corp. (AQN) - Price to Sales|BKH - Price-to-Revenue Ratio|ELP (Copel Energia) - Market Cap to Revenue Ratio|CIG: P/S Multiple|Price to Sales TransAlta Renewables (TAC)|Price-to-Revenue Ratio ALLETE, Inc.|NWE: Market Capitalization-to-Revenue Ratio|P/S Multiple MGEE|Chesapeake Utilities Corp (CPK) - Price-to-Revenue Multiple|Avista Utilities - Market Cap to Revenue|NW Natural Corp (NWN) - Price to Sales|CEPU: Market Cap to Revenue|Market Capitalization-to-Revenue Ratio SPH (suburbanpropane.com)|NGL Energy Partners LP (NGL) - Price-to-Revenue Ratio|UTL - Price-to-Revenue Coefficient|Market Cap to Revenue GNE|P/S Multiple Star Group Corp|Price-to-Revenue Ratio Edenor (EDN)|RGCO: Price-to-Sales Ratio|Price-to-Revenue Ratio NextNRG NXXT|AGR (Avangrid Inc) - Price-to-Sales Ratio|PNM - Price-to-Revenue Ratio|TVE: Price-to-Revenue Ratio