EZFL (EZFill Holdings, Inc.) Market Value to Book Value Ratio
Corporate company logo of EZFill (EZFL)

The resilience of EZFill Holdings Inc. (EZFL) is based on B2B contracts and an asset-light model that generates a stable cash flow. The company's P/BV ratio confirms this trend, where the 6.15 level records fresh values. Mobile refueling optimizes energy supply for vehicle fleets, while the integration of IT solutions smooths out the cyclical volatility of tariffs, supporting the business's operational efficiency.

getyourezfill.com (EZFL) Market-to-Book Ratio: for the period 07/04/2022 - 02/14/2025
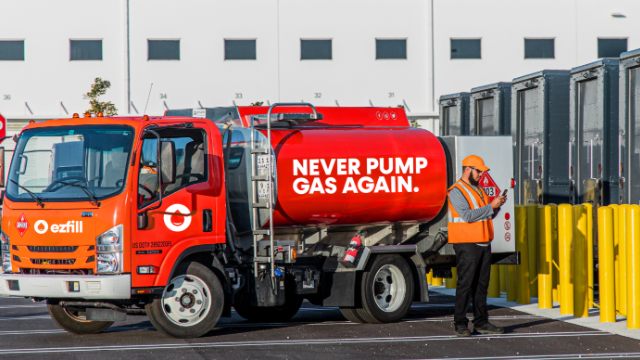
Flagship merchandise of getyourezfill.com

The development of EZFill Holdings Inc. (EZFL) relies on attracting skilled personnel and implementing eco-friendly IT solutions for gas stations. This ratio compares the current market value of the business with its net assets on the balance sheet. It is critical for the investor to determine whether the innovation premium is justified by actual capital. An analysis of the ratio between the company's market valuation and its book value reveals speculative imbalances. Comparing current values with the long-term median on this chart confirms the resilience of the investment thesis.

Competitor analysis for EZFill Holdings Inc.

up.com (UNP) - Market Value to Book Value Ratio|PLD (prologis.com) - Market Value to Book Value Ratio|Market Value to Book Value Ratio CPKC|Market Value to Book Value Ratio NSC|Market Value to Book Value Ratio CSX Corporation (CSX)|CNI - Market-to-Book Ratio|Market Capitalization to Book Value Ratio PCAR (PACCAR Inc)|Market Value to Equity Ratio publicstorage.com|C.H. Robinson Worldwide - Market Capitalization to Book Value Ratio|Market Capitalization to Book Value XPO, Inc. XPO|U-Haul Corp (UHAL) - Market Value to Book Value Ratio|SAIA - Market Capitalization to Book Value|Market Cap to Net Assets Ratio TFII|R (ryder.com) - Market Cap to Book Value Multiple|Market Cap to Net Assets Ratio KNX (Knight-Swift)|GATX (gatx.com) - Market Value to Book Value|Market Capitalization to Book Value Ratio LSTR (Landstar System Inc)|Schneider (SNDR) - Market-to-Book Ratio|RXO Logistics - Market Capitalization to Book Value Ratio|TRN - Market Capitalization to Book Value Ratio|Werner Logistics (WERN) - Market Value to Book Value Ratio|Distribution Solutions Group Inc - Market Value to Book Value|Market Cap to Net Assets Ratio SCSC|HTLD (Heartland Express Inc.) - Market Cap to Book Value Multiple|Market Capitalization to Book Value Ratio HY|ULH (universallogistics.com) - Market Value to Book Value|Market Capitalization to Book Value Ratio CVLG (Covenant Logistics Group)|Wabash National Corporation (WNC) - Market-to-Book Ratio|OMI: Market Cap to Net Assets Ratio|Market Capitalization to Net Assets RLGT|PAMT: Market Capitalization to Book Value Ratio|Market Capitalization to Net Assets PAL (Proficient Auto Logistics, Inc.)|RAIL (FreightCar America, Inc.) - Market Capitalization to Book Value Ratio|MingZhu Logistics Holdings Ltd (YGMZ) - Market Capitalization to Book Value|Market Value to Book Value Ratio Eastern International Ltd (ELOG)|Market Value to Book Value Ratio HXHX (Haoxin)|Market Value to Book Value Ratio Addentax Group ATXG|Cheetah Net Supply Chain Corp - Market Value to Book Value Ratio|NKLA: Market Cap to Net Assets Ratio|Market Value to Book Value PTSI (P.A.M. Transportation Services, Inc.)|DSKE: Market Capitalization to Book Value Ratio