FMS - Fresenius Medical Company Value to Earnings Growth Ratio

Symbol and logo of brand Fresenius Medical Care (FMS)

Fresenius Medical Care is implementing automated dialysis systems with digital control to reduce staff workload. The undervalued growth company search indicator reflects price action where the parameter value equals 21.11. Geopolitical risks and sanctions complicate logistics in conflict zones. Meanwhile, stable demand for consumables ensures a steady cash flow and operational resilience.

Fresenius Medical Care AG (FMS) - Price/Earnings to Growth Ratio from 07/04/2022 to 11/12/2026

Metric breakdowns and analytics for Fresenius Medical Care (FMS)
- stock price and consensus target price:
General company analysis:FMS - Fresenius Medical Care AG
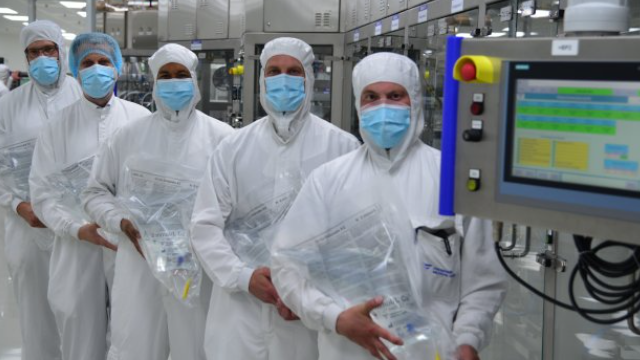
Mass-produced product of Fresenius Medical Care AG & Co. KGaA

Reducing investment risks requires aligning business valuation with profit dynamics, which is critical for Fresenius Medical Care (FMS) during its period of margin recovery and clinic optimization. The ratio of the P/E multiple to growth rates, reflected in the growth potential p/e metric, reveals the asset is undervalued when the value is below one, signaling capitalization potential relative to fundamental development.

Competitors of Fresenius Medical Care

hcahealthcare.com - Growth-Adjusted P/E Ratio|Tenet - Price/Earnings to Growth Multiple|Company Value to Earnings Growth Ratio SOLV (Solventum Health)|Encompass Health - PEG Multiple|Market Cap to Earnings and Growth Ratio UHS|DaVita (DVA) - Price/Earnings to Growth Ratio|RadNet Inc - Growth-Adjusted Payback Ratio|OPCH (Option Care Health Inc) - PEG Multiple|Price to Earnings Adjusted for Growth Rate Surgery Partners Group SGRY|Price/Earnings to Growth Ratio Premier, Inc. (PINC)|Growth-Adjusted Market Cap to Net Income nationalvision.com|PEG Multiple PGNY (Progyny)|Ardent Health (ARDT) - Price to Earnings Adjusted for Growth Rate|SEM - Price/Earnings to Growth Ratio|ASTH (Astrana Corp) - Growth-Adjusted P/E Ratio|MD: PEG Multiple|USPH - Growth-Adjusted Market Cap to Net Income|Price/Earnings to Growth Multiple PNTG|PEG Multiple Organogenesis Holdings Inc.|Price/Earnings to Growth Ratio Nutex Health Corp (NUTX)|Growth-Adjusted Market Cap to Net Income Auna Corp|SBC Medical Group Holdings Inc - Price/Earnings to Growth Multiple|Growth-Adjusted Payback Ratio EOLS|CYH - Price/Earnings to Growth Ratio|The Beauty Health (SKIN) - Price/Earnings to Growth Multiple|MDWD: PEG Multiple|Price to Earnings Adjusted for Growth Rate Biote Corporation (BTMD)|JYNT (The Joint Corp.) - PEG Multiple|Growth-Adjusted P/E Ratio DCGO (docgo.com)|PEG Multiple PIII|Growth-Adjusted Market Cap to Net Income Gain Therapeutics Inc.|PEG Multiple EUDA (EUDA Health)|BMGL - Price/Earnings to Growth Multiple|CollPlant Ltd - PEG Multiple|CUPR - PEG Multiple|Concord Medical (CCM) - Price/Earnings to Growth Ratio|AMS (American Shared Hospital Services Inc) - Price/Earnings to Growth Ratio|Price/Earnings to Growth Multiple MRM|ALBT: Growth-Adjusted Payback Ratio|PEG Multiple DHAI|Price/Earnings to Growth Multiple carmellcosmetics.com XAGE|PEG Multiple NIVF (NewGenIvf)|PEG Multiple ATI Physical Therapy Inc. ATIP|CMAX - Price/Earnings to Growth Ratio|Growth-Adjusted Payback Ratio KDLY (Kindly Health)|MODV: PEG Multiple|Price to Earnings Adjusted for Growth Rate novointegrated.com (NVOS)|SSY (SunLink Health Systems Inc.) - PEG Multiple|IMAC Holdings Inc - Market Cap to Earnings and Growth Ratio