Friedman Industries, Incorporated - FRD Net Assets per Single Share
This price evolution chart for Friedman Industries (FRD) on GURU.Markets demonstrates the impact of global steel and scrap prices, as the company lacks pricing power. Experienced management ensures price stability through strict cost control, with the current metric standing at 22.78. Business efficiency relies on the spread between raw material and finished product costs, as well as construction market activity.

friedmanindustries.com - analytical breakdowns and key metrics (FRD)
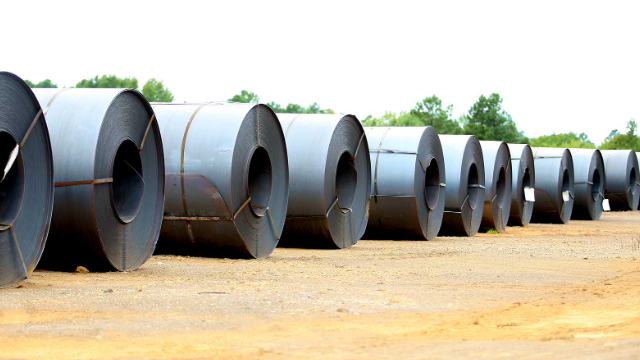
For Friedman Industries (FRD), which operates in the volatile rolled steel market, this metric determines the real net asset value per share after deducting all liabilities. The equity per share trend allows investors to filter out market noise and assess how US infrastructure demand and inventory management efficiency translate into an actual strengthening of the company's financial foundation.