FTK Flotek: Price-to-Projected Revenue Ratio

Flotek Industries, Inc. - graphic logo of issuer FTK

The forward P/S ratio reflects the valuation dynamics of Flotek Industries, Inc. (FTK), where 1.70 determines this specific parameter level. Flotek Industries, Inc. (FTK) has developed a network of eco-friendly chemical solutions to optimize production. The company's own plants located near key US basins guarantee service stability. Growth is supported by a major contract with an anchor owner, precluding external acquisitions to ensure full capacity utilization.

FTK (flotekind.com) Price-to-Projected Revenue Ratio history from 07/04/2022 to 11/17/2026

Summary analytical data breakdowns for Flotek Industries, Inc. (FTK)
- current price and projected stock value:
Initial company analysis:FTK (Flotek)
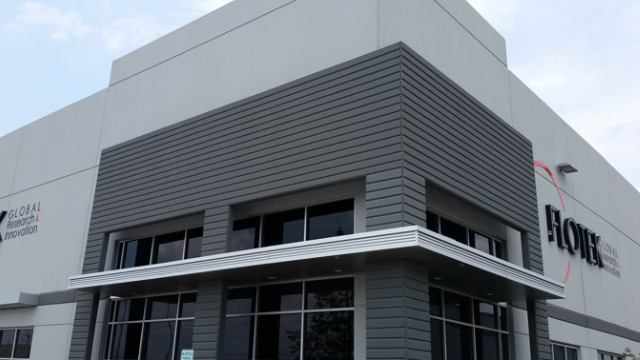
Product sample of Flotek

To assess the credit quality of Flotek Industries, Inc. (FTK), the analyst compares market capitalization with expected revenue using a forward P/S multiple to identify the impact of cost inflation on potential demand. Given the high cyclicality of the oilfield services sector and its dependence on shale company CAPEX, this indicator determines the extent to which the asset's current value is justified by sales forecasts amidst the risk of falling oil prices.

Analysis of competing companies

Forward P/S Multiple SLB (Schlumberger)|Baker Hughes Inc. (BKR) - Market Cap to Future Revenue Ratio|HAL - Price-to-Projected Revenue Ratio|Forward Price to Sales FTI (TechnipFMC)|NE: Forward P/S Multiple|Weatherford Corp - Forward Price to Sales|Forward Price-to-Revenue Multiple AROC|Ensco Rowan (VAL) - Market Cap to Expected Sales Ratio|Forward P/S Multiple RIG|Market Cap to Expected Sales Ratio USA Compression Partners|Forward P/S Multiple TDW (Tidewater Corp)|Kodiak Gas Services Inc (KGS) - Market Cap to Future Revenue Ratio|Patterson-UTI Energy - Forward P/S Multiple|Market Cap to Future Revenue Ratio Seadrill Offshore|HP: Forward P/S Multiple|LBRT - Market Cap to Expected Sales Ratio|ARIS (solariswater.com) - Forward P/S Multiple|Market Cap to Future Revenue Ratio Expro Group Holdings NV XPRO|Price-to-Projected Revenue Ratio Innovex International Inc (INVX)|WTTR - Market Cap to Future Revenue Ratio|RPC, Inc. - Forward Price-to-Revenue Multiple|Market Cap to Expected Sales Ratio Helix Energy Solutions Group, Inc. (HLX)|BORR - Price-to-Projected Revenue Ratio|Market Cap to Expected Sales Ratio Precision Drilling Corp PDS|TTI (Tetra Technologies) - Forward Price-to-Revenue Multiple|NBR - Market Cap to Expected Sales Ratio|ACDC (ProFrac Corp) - Forward P/S Multiple|Forward P/S Multiple Core Laboratories Inc.|Price-to-Projected Revenue Ratio ProPetro (PUMP)|MTRX (Matrix Service Co) - Forward Price to Sales|Forward P/S Multiple RNGR (rangerenergy.com)|Forward Price to Sales TUSK|DTI: Forward Price-to-Revenue Multiple|Odyssey Marine Exploration (OMEX) - Forward Price-to-Revenue Multiple|Dawson Geophysical Corp (DWSN) - Price-to-Projected Revenue Ratio|Market Cap to Future Revenue Ratio KLX Energy Services (KLXE)|Forward Price-to-Revenue Multiple NINE|WBI: Forward Price to Sales|Price-to-Projected Revenue Ratio ChampionX Corporation (CHX)|DO - Market Cap to Future Revenue Ratio|Price-to-Projected Revenue Ratio ENGlobal ENG|ENSV (Enservco Corporation) - Future Price to Revenue|ICD - Price-to-Projected Revenue Ratio|SOI: Price-to-Projected Revenue Ratio