The Gap - GAP Forward P/S Multiple

Cash flows for The Gap, Inc. (GAP) depend on inventory management efficiency and LFL sales. The data sequence on the GURU.Markets chart for the forward P/S indicator confirms this trend, where the 0.70 metric expresses the state of the indicator. The business model relies on the full outsourcing of production and logistics, while the defensive nature of demand helps the company offset inflation and maintain traffic.

GAP (Gap Inc): analytical breakdowns and indicator data
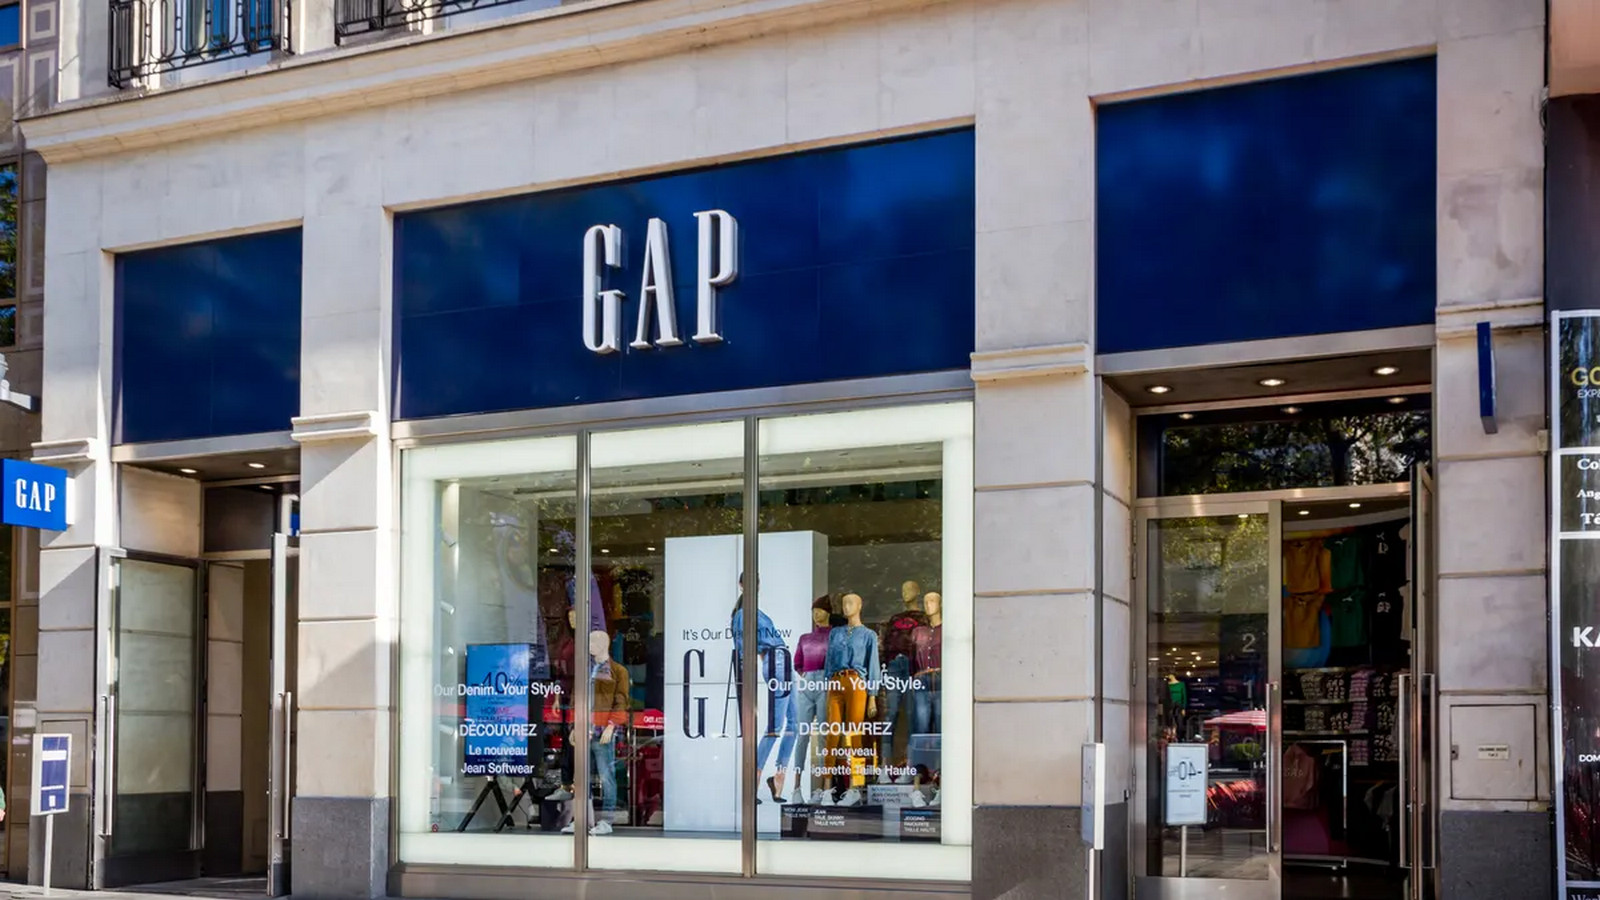
The Gap, Inc. investments in AI fitting rooms and logistics automation are laying the foundation for e-commerce revenue expansion. The forward P/S reflects the market valuation of this efficiency, correlating current market capitalization with projected sales volume for the next period. By analyzing the P/S expectations for The Gap, Inc., an investor determines the extent of the premium paid for future growth or identifies a point of asset undervaluation.
