GEHC - GE HealthCare Inc. Company Value to Earnings Growth Ratio

GE HealthCare dominates the complex imaging niche, leveraging its extensive installed base. The PEG ratio reflects current valuation dynamics, where 1.48 becomes the new value for this metric. AI technologies and precision medicine provide growth potential, although geopolitical tensions and export restrictions in Asia may hinder the global expansion of the business.

Metric breakdowns and analytics for GE HealthCare (GEHC)
- price and consensus price forecast:
- market capitalization statistics:
- book capitalization information:
- debt obligations and liquidity statistics:
All Debt to Shareholders' Equity Ratio GE HealthCare|GEHC - Long-Term Debt to Equity|Short-Term Debt to Equity Ratio gehealthcare.com|GEHC - Company Aggregate Debts|Debts to Book Value GE Healthcare Corp|GEHC - Company Long-Term Debts|Company Short-Term Indebtedness GE HealthCare|Interim Coverage Ratio gehealthcare.com
- net income and valuation ratios data:
GEHC - Net Profit|Future Profit GE HealthCare|GEHC - P/E Multiple|Forward P/E Multiple GE HealthCare Inc.|GEHC - Price/Earnings to Growth Ratio|Enterprise Value to Earnings Before Interest, Taxes, Depreciation and Amortization GE Healthcare Corp|GEHC - Operating profit before deduction of amortization|Earnings per share for the trailing year GE HealthCare|GEHC - Net earnings per share (EPS TTM)|Earnings per share growth in annualized terms for the last twelve months gehealthcare.com|GEHC - Earnings per share growth in current year|Net earnings per one share growth forecast for next year GE HealthCare
General company analysis:GEHC - GE HealthCare Technologies Inc.
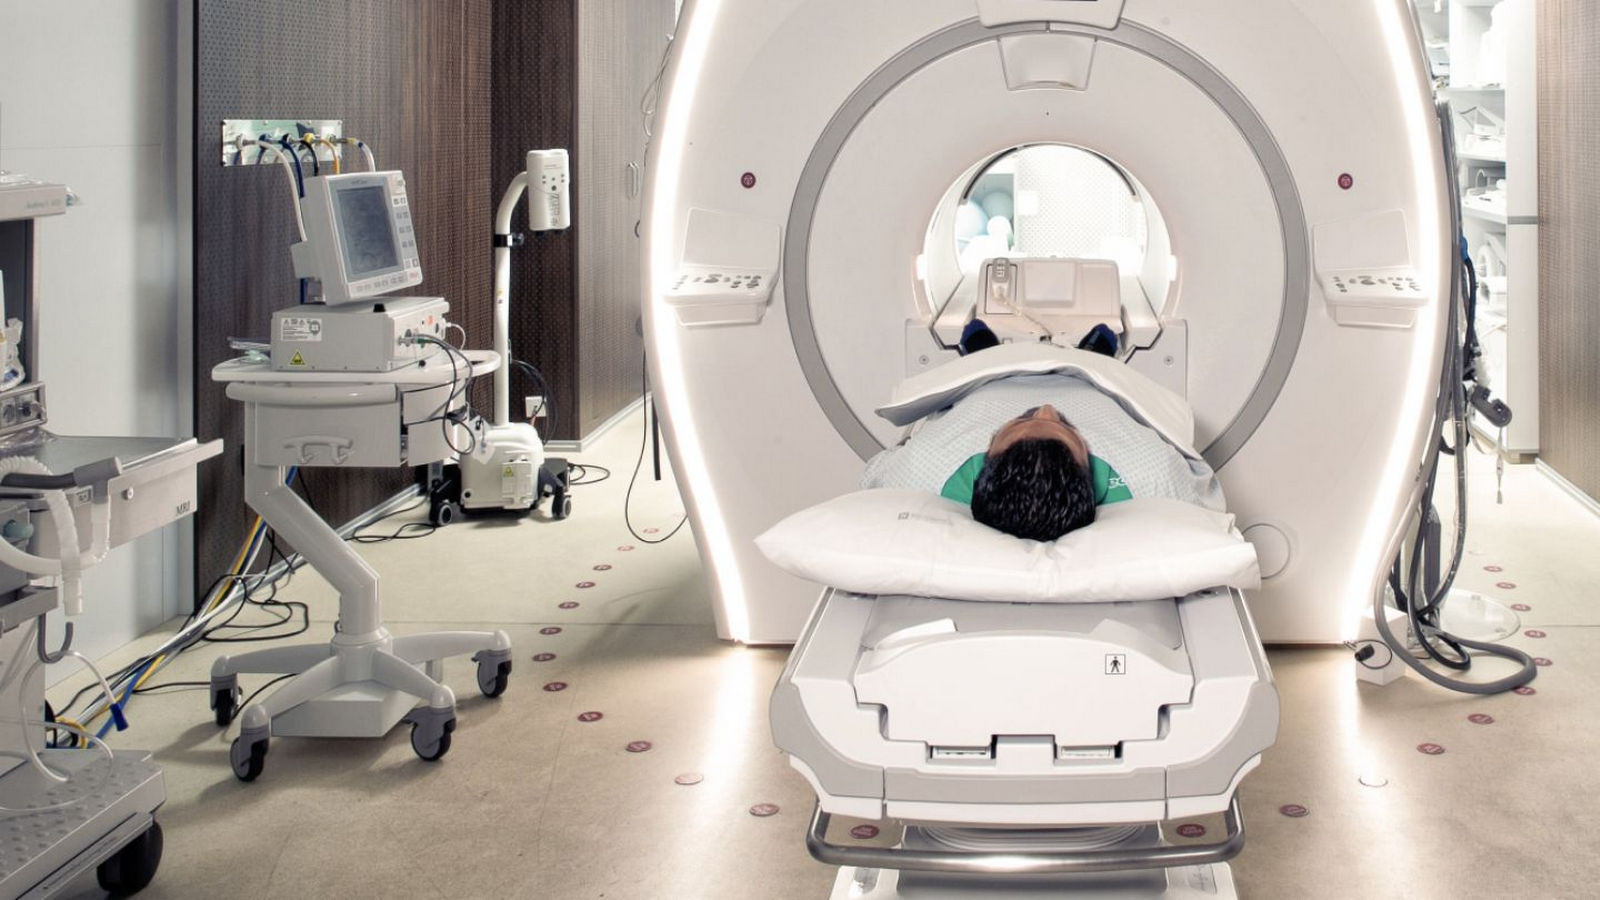
Steady demand for diagnostic equipment upgrades at GE HealthCare (GEHC) creates a reliable cash flow that serves as the foundation for assessing business efficiency. By analyzing the PEG ratio, an investor compares the market multiple with earnings expansion rates, where a value below one signals that the asset is undervalued relative to its growth potential.
Competing companies
Growth-Adjusted Market Cap to Net Income Abbott Labs|Thermo Fisher Corp - Price/Earnings to Growth Multiple|Company Value to Earnings Growth Ratio MTD (Mettler Toledo Inc)|Waters Corporation - PEG Multiple|Growth-Adjusted Market Cap to Net Income bio-techne.com TECH|BRKR: PEG Multiple|Price/Earnings to Growth Multiple Azenta Inc|Price/Earnings to Growth Multiple VREX|SMLR: Growth-Adjusted Payback Ratio|Price/Earnings to Growth Ratio Butterfly Network, Inc. (BFLY)|Price/Earnings to Growth Multiple mesalabs.com MLAB|PEG Multiple QSI (Quantum-Si Incorporated)|Nano-X Imaging (NNOX) - Price to Earnings Adjusted for Growth Rate|Quanterix Corp - PEG Multiple|MASS (908 Devices Corporation) - Growth-Adjusted P/E Ratio|CV: PEG Multiple|MXCT - Growth-Adjusted Market Cap to Net Income|RPID (Rapid Micro Biosystems Inc.) - PEG Multiple|Price/Earnings to Growth Multiple Seer Inc (SEER)|PEG Multiple HYPR|PEG Multiple FONAR Corporation Inc (FONR)|Price/Earnings to Growth Ratio Daxor DXR|Spectral AI Inc. - Price/Earnings to Growth Ratio|VIVS: Price/Earnings to Growth Multiple|Growth-Adjusted Payback Ratio ACON (Aclarion Inc)|AKYA: PEG Multiple|Price to Earnings Adjusted for Growth Rate Cesca Therapeutics (THMO)|Price/Earnings to Growth Ratio Talis Biomedical Corp.|TTOO - Price to Net Income Growth Ratio
