General Mills - GIS Net Assets per Single Share

Graphic logo of General Mills (GIS)

General Mills, Inc. (GIS) is a defensive asset within the FMCG sector, whose inflation resilience and stable cash flow are based on product demand. The current BVPS value clearly demonstrates the dynamics of net equity, while the 13.86 level represents the current value of the metric. Business scalability relies on massive production volumes, and the dominance of its breakfast brands creates a reliable barrier to entry for new players.

GIS: General Mills Corp Net Asset Value per Share 07/04/2022 - 10/28/2026
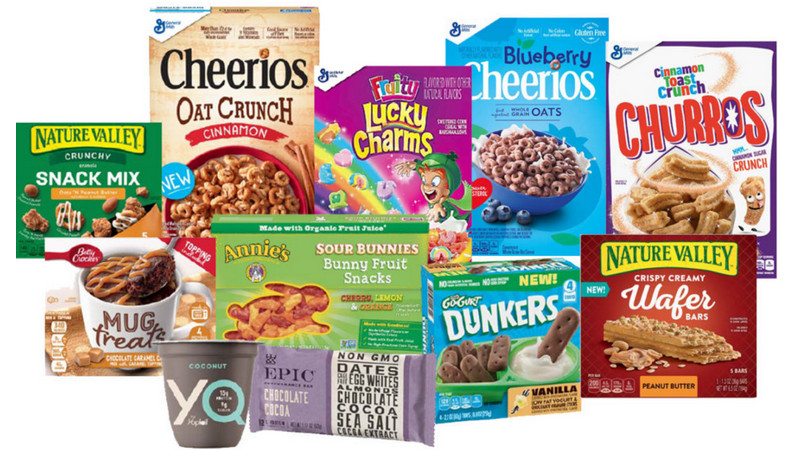
Product sample of General Mills Inc

Assessing asset quality requires an analysis of the net capital value available to each shareholder. This metric calculates the difference between total assets and liabilities, determining the business's actual internal reserve. By analyzing BVPS dynamics, an investor can identify protection against inflationary depreciation. For General Mills, Inc. (GIS), the stability of this metric confirms the reliability of the defensive asset. The low cyclicality of demand for food products guarantees capital resilience even during crisis periods.

Competitors of General Mills, Inc. (GIS)

Net Assets per Single Share KHC (Kraft Heinz Corp)|K: Net Assets per Share|McCormick & Company - Net Assets per Single Share|JBS S.A. (JBS) - Net Assets per Share|Book Value per Share HRL (Hormel Foods)|Net Asset Value per Share SJM|Net Assets per Single Share PPC (Pilgrim's Corp)|Accounting Value per Share Campbell's Soup (CPB)|Book Value per Share SFD|INGR - Net Assets per Share|Accounting Value per Share LW|BRFS - Book Value of One Share|Book Value per Share Post Consumer Brands (POST)|Marzetti (MZTI) - Share Book Value|BRBR: Book Value per Share|Net Assets per Share TR|Net Assets per Single Share Flowers Foods FLO|Equity per Share The Simply Good Foods (SMPL)|Book Value per Share NOMD|WK Kellogg Cereal - Net Assets per Share|Net Assets per Single Share JJSF (J&J Snack Foods)|UTZ - Net Assets per Share|Book Value per Share TreeHouse Foods THS|SunOpta Inc (STKL) - Accounting Value of a Share|Book Value per Share JBSS (Fisher Nuts)|Net Asset Value per Share Seneca Foods Company|Book Value per Share Lifeway Foods, Inc. LWAY|Equity per Share mamascreations.com MAMA|Accounting Value per Share B&G Foods|Accounting Value of a Share Beyond Meat Inc BYND|Book Value per Share Hain Celestial|BRID: Share Book Value|Net Assets per Single Share WYHG|LSF (lairdsuperfood.com) - Net Asset Value per Share|Net Assets per Single Share BRLS (Borealis Foods)|Net Asset Value per Share Farmer Brothers|Book Value per Share BranchOut Food Inc. BOF|Equity per Share pinnaclefoodinc.com (PFAI)|SOWG (Sow Good) - Book Value per Share|Book Value of One Share imperialcristalcaviar.com TWG|STKH (Steakholder Foods) - Book Value per Share|BSFC: Net Asset Value per Share|Net Assets per Single Share wholeearthbrands.com|T. Marzetti (LANC) - Equity per Share|Book Value per Share RGF (The Real Good Food Company Inc.)|Net Asset Value per Share SNAX|Sovos Brands (SOVO) - Net Assets per Single Share