Canada Goose Holdings (GOOS) Price to Earnings Multiple

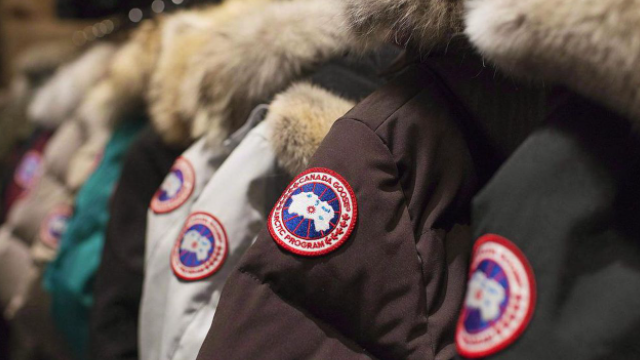
Corporate emblem and logo of Canada Goose Holdings (GOOS)

Risks of declining luxury demand and raw material inflation are squeezing margins for Canada Goose Holdings (GOOS). The company's market P/E ratio illustrates the price action in response to these challenges, where the value 11.60 captures the current state. The stable status of the elite brand is complemented by the development of eco-textiles and production automation, creating long-term growth potential for the business.

GOOS Canada Goose Holdings Inc. Price to Earnings Ratio (07/04/2022 - 11/16/2026)

Analytical breakdowns for Canada Goose Holdings
- market value and analyst target forecast:
Summary company analysis:GOOS, Canada Goose Corp
Brand item of Canada Goose Holdings

The P/E ratio measures the market value of a single unit of net profit, allowing for the determination of the premium paid for an asset relative to its ability to generate income. Analyzing the valuation of Canada Goose Holdings (GOOS) via the P/E ratio helps identify value traps, given that the high proportion of manual labor in Canada Goose Holdings (GOOS) production limits business scalability and impacts long-term profitability.

Analysis of competing companies

Price to Earnings Multiple NKE (Nike)|P/E Multiple TPR|Lululemon Athletica Inc. - Price to Earnings Multiple|P/E Multiple RL (Ralph Lauren Corporation)|Market Cap to Net Income Ratio UGG|ONON: Price to Earnings Ratio|SKX: Price to Earnings Ratio|LEVI: P/E Multiple|Gildan Activewear Inc - Company Value to Net Income|VFC (VF Group) - P/E Multiple|P/E Multiple kontoorbrands.com|P/E Multiple CROX|PVH Corp - Price to Earnings Multiple|P/E Multiple ZGN (Ermenegildo Zegna)|UNF: Price to Earnings Multiple|Columbia Sportswear Company - P/E Multiple|CPRI (capriholdings.com) - Price to Earnings Multiple|WWW (Wolverine World Wide, Inc.) - Price to Earnings Ratio|SHOO - Business Payback Period|HBI (Hanesbrands Inc) - P/E Multiple|Price to Earnings Ratio VSCO|P/E Multiple UA|Business Payback Period FIGS Inc|P/E Multiple GIII (G-III Apparel)|Market Price to Net Income Ratio CRI (Carter's)|GES - Price to Earnings Ratio|Company Value to Net Income OXM (Oxford Corp)|Movado Group Inc (MOV) - Price to Earnings Ratio|Market Cap to Earnings Weyco Group, Inc. (WEYS)|Price to Earnings Ratio Lanvin|RCKY: Company Value to Net Income|Price to Earnings Ratio CURV (Torrid Holdings, Inc.)|SGC (Superior Group of Companies) - Company Value to Net Income|Price to Earnings Ratio The Children's Place PLCE|Market Cap to Net Income Ratio fossilgroup.com|DLTH - Price to Earnings Ratio|Company Value to Net Income LAKE (lakeland.com)|Top Win International Ltd (SORA) - Price to Earnings Ratio|Price to Earnings Multiple AKA|UFI (REPREVE) - P/E Multiple|Market Cap to Earnings Vera Bradley VRA|P/E Multiple JRSH|Vince - Price to Earnings Multiple|Tandy Leather Factory - Price to Earnings Ratio|LVLU: Price to Earnings Multiple|BrilliA Incorporated - P/E Multiple|FMFC - P/E Multiple|MJID (Majestic Ideal) - Price to Earnings Ratio|MGOL - Business Payback Period