GSL Global Ship Lease, Inc.: Price Chart

The share price history of Global Ship Lease, Inc. (GSL) on the GURU.Markets platform allows for an assessment of the vessel leasing model, where returns are based on long-term contracts with minimal staffing. The current indicator stands at 41.85. However, the company faces a debt burden and costs for the environmental upgrade of the fleet amid a decline in global trade. At the same time, strict charters neutralize the threats of early contract termination even during a correction of market rates.

Summary analytical data breakdowns for Global Ship Lease, Inc. (GSL)
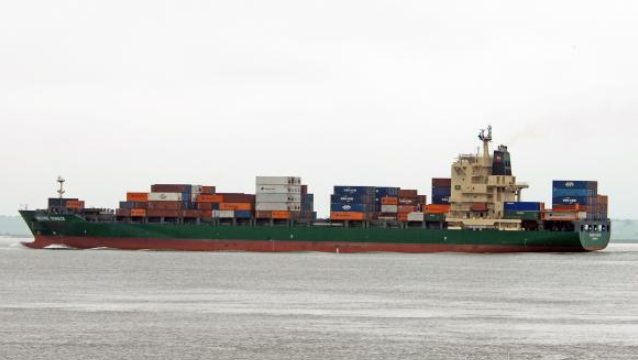
The steady cash flow from the long-term container ship charters of Global Ship Lease, Inc. (GSL) creates a foundation for predictable market value. The price captures the final transaction amounts for the session, reflecting the aggregate valuation of assets by investors. Comparing this data with financial statements allows for the identification of the true drivers of growth or decline. Fundamental selection requires an analysis of the market reaction to dividend payments. The reversal in price action visualizes the final chain of economic decisions.
