HSBC Holdings (HSBC) Company Sales Volume

The sales chart for HSBC Holdings plc (HSBC) demonstrates revenue dynamics, where the current level equals 136.89. Growth is based on a global network that connects world trade flows and creates high customer dependency. However, development is constrained by geopolitical pressure and competition with digital fintech platforms. Final profitability relies on dominance in Hong Kong, which is offset by fierce price competition in the corporate sector.

Analytical breakdowns for HSBC Holdings plc
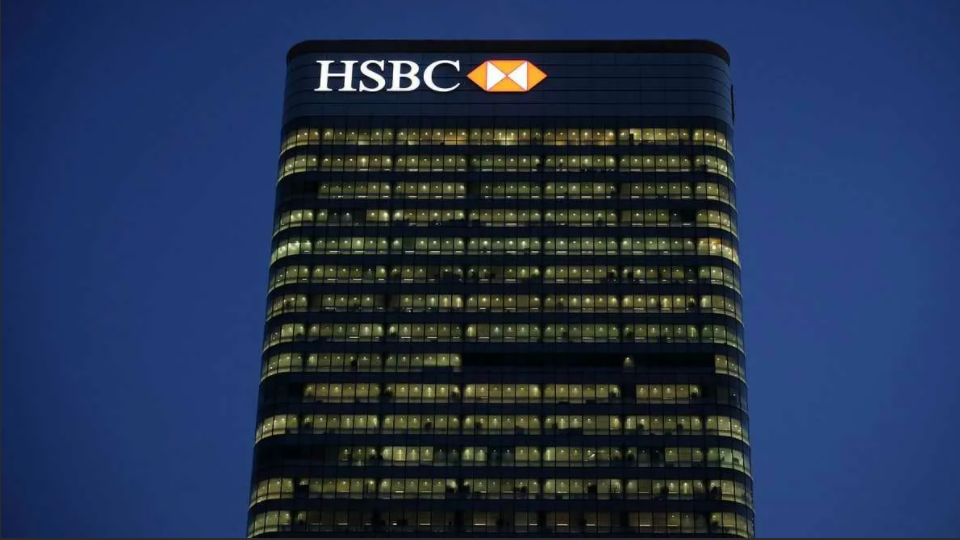
For HSBC Holdings plc, the dynamics of fund inflows confirm the resilience of its global business model. An analysis of the company's commercial revenue allows for a comparison between stated stability and actual liquidity inflows. Sharp fluctuations in the curve signal risks of capital freezes or reporting manipulations. This metric is critical for the bank, as the colossal costs of multi-jurisdictional compliance require a stable cash flow. It is essential for investors to monitor the smoothness of the chart to assess the structural regulatory endurance.
