Earnings per share for the last twelve months: Hydrofarm Holdings, Inc. (HYFM)

Rising energy costs and trade tariffs on electronics from Asia are squeezing margins at Hydrofarm Holdings (HYFM), as evidenced by the trend in trailing 12-month earnings per share. The -58.42 level reflects the current value of this metric. A recovery in hydroponics demand and inventory optimization support the business, while the patent portfolio for lighting systems creates a defensive barrier.

Analytical breakdowns for hydrofarm.com (HYFM)
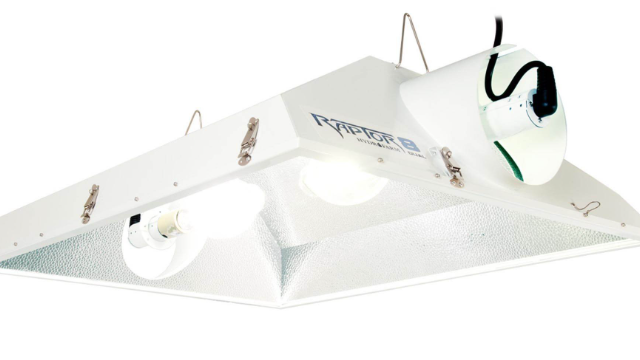
Hydrofarm Holdings specializes in the distribution of hydroponic equipment, leveraging exclusive brands and complex logistics. The EPS TTM figure quantifies the efficiency of this model by dividing the total annual net income by the total number of shares. This metric measures the actual earnings per share, adjusted for the impact of issuance. A decline in this value signals a risk of capital loss. By analyzing the current level of trailing earnings per share, an investor assesses the business's resilience.
