Installed Building Products Inc (IBP) - Market Cap to Net Income Ratio

Installed Building Products (IBP) is optimizing costs by engaging external material suppliers and third-party logistics. The cost-to-profit trend clearly demonstrates the return on investment dynamics, where 24.10 reflects the latest metric level. High developer confidence is based on installation quality and an extensive office network, while a strategy of acquiring local players strengthens its leadership in the finishing segment.

Analytical breakdowns for Installed Building Products
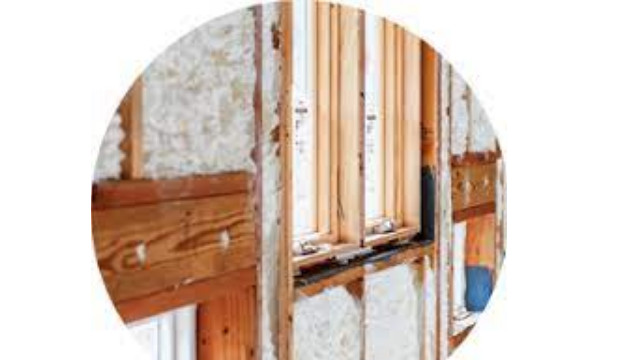
The dominance of Installed Building Products (IBP) in the building materials segment, driven by technological superiority and market influence, is reflected in the company's P/E valuation profile. This ratio correlates current market capitalization with net income, measuring the investment payback period and the degree of asset overvaluation, which confirms the fundamental stability of the business while maintaining operational leadership.
