JBTM: JBT Corp Growth-Adjusted Market Cap to Net Income

The PEG ratio chart illustrates the market valuation of JBT Marel Corp (JBTM), where 0.68 captures the magnitude of this parameter. Effective outsourcing of standard components minimizes costs without compromising quality. Growth is driven by the merger with Marel and the demand for automation resulting from labor shortages. The implementation of AI in food processing and digital logistics confirms the company's immense potential for technological progress.

Analytical breakdowns for JBT Marel Corp (JBTM)
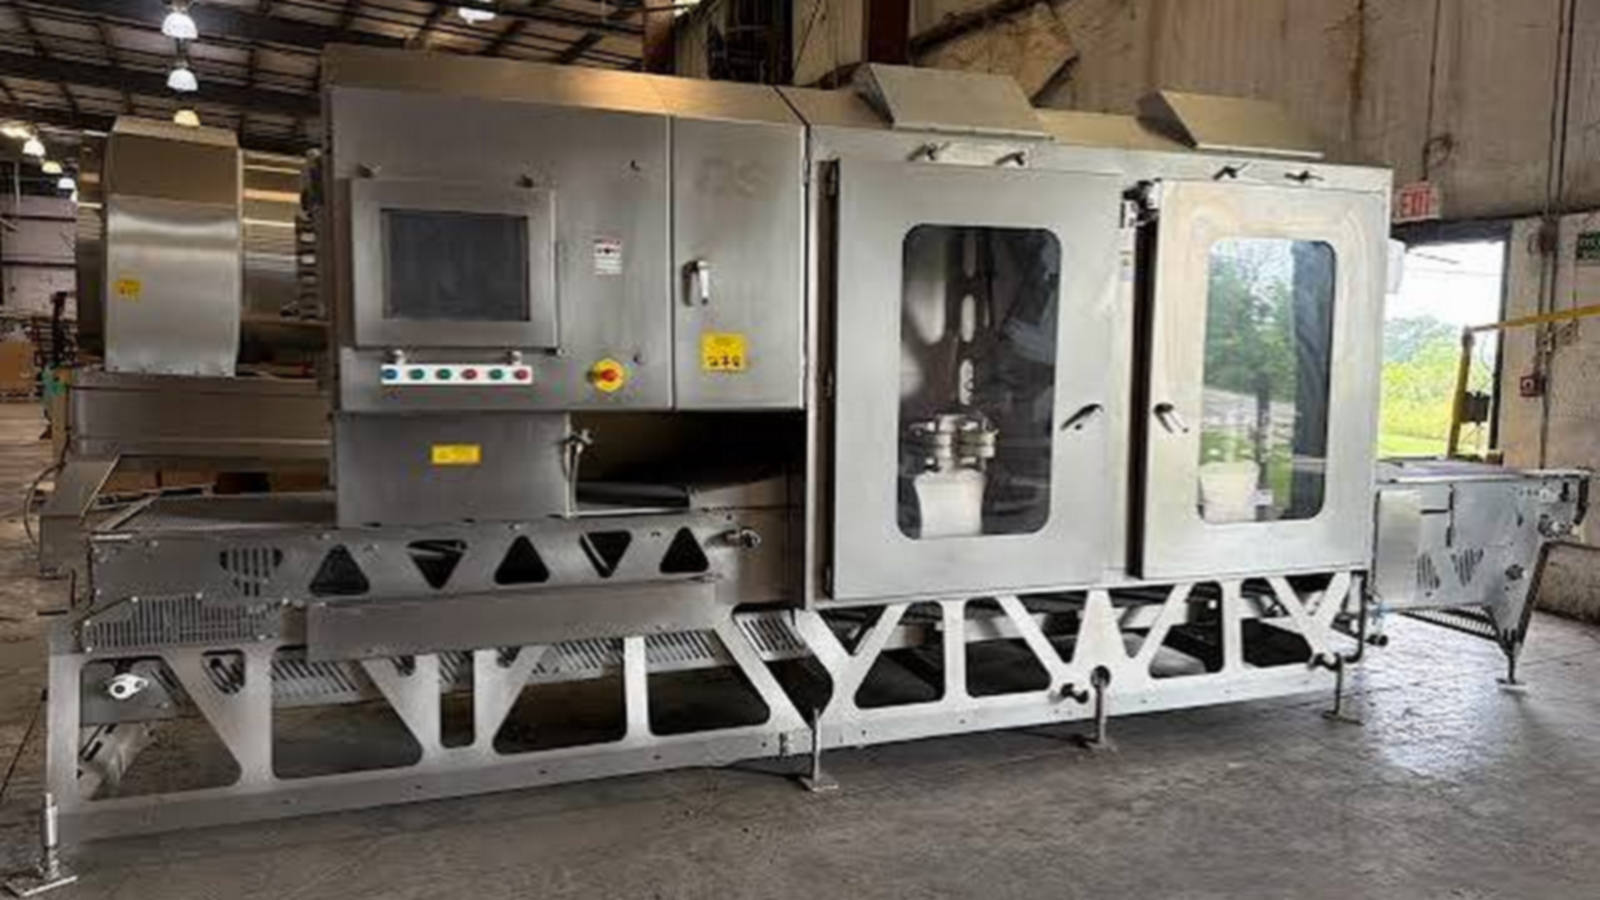
High plant utilization and the modernization of production lines at JBT Marel Corp. (JBTM) create a foundation for accelerated earnings, which directly impacts the PEG ratio calculation. This coefficient compares the P/E market multiple with earnings growth rates to determine the asset's fair value; meanwhile, a growth-adjusted P/E value below one confirms the business is fundamentally undervalued.
