KBH - KB Home Corp Net Sales Margin

The build-to-order model optimizes capital, although the business relies critically on external contractors. The net margin profile of KB Home (KBH) on the GURU.Markets chart shows that the latest reading is 4.40. Process efficiency is ensured by in-house designers and site managers, whose motivation is directly tied to the volume of completed housing.

Analytical breakdowns for KB Home
- share price and consensus valuation forecast:
- market capitalization statistics:
- balance sheet net asset value indicators:
- business debt structure and liquidity details:
- earnings and market multiples details:
KBH - Net Profit|Projected Future Earnings KB Home|KBH - Price to Earnings Ratio|Forward P/E Multiple KB Home Corporation|KBH - Price/Earnings to Growth Multiple|Enterprise Value to Earnings Before Interest, Taxes, Depreciation and Amortization Kaufman & Broad|KBH - Profit before interest, taxes and amortization|Earnings per share for the last twelve months KB Home|KBH - Net earnings per share for the last 12 months|Year-over-year earnings per share growth for the last twelve months kbhome.com|KBH - Net earnings per share growth this year|Net earnings per share growth forecast for next year KB Home
- sales volume and revenue indicators:
- margin metrics data:
Initial company analysis:KB Home Inc. - KBH
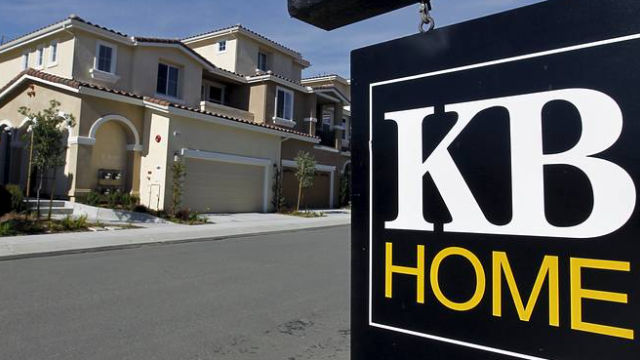
As one of the leaders in residential construction, KB Home (KBH) depends on mortgage rates and market demand, which limits its pricing power. The company's sales margin history reflects the share of net income in revenue, allowing investors to distinguish real operational efficiency from speculative price growth and avoid purchasing an overheated asset at its peak.
Direct competitors
Marriott (MAR) - Net Margin|D.R. Horton Inc - Net Profit Rate|Return on Sales by Net Profit BEKE|Net Margin TOL|Return on Sales by Net Profit FSV (FirstService Corp.)|Opendoor Technologies - Net Return on Sales|Net Margin Taylor Morrison Homes TMHC|Net Sales Margin Meritage Homes Corporation MTH|MRP - Net Margin|Net Profit Rate CVCO (Cavco Industries Inc)|Champion Homes (SKY) - Net Margin|MHO - Company Sales Margin|Net Margin Green Brick Partners, Inc.|TPH (Tri Pointe Homes) - Company Net Profitability|Net Margin Mobile Modular (MGRC)|Dream Finders Corp - Net Return on Sales|Net Margin centurycommunities.com CCS|Net Sales Margin porchgroup.com PRCH|ELME - Net Margin|Company Sales Margin LGI Homes Inc LGIH|TH: Net Sales Margin|HOV: Company Net Profitability|Net Margin Anywhere Real Estate|Net Sales Margin beazer.com|Net Sales Margin LEGH|BETR (Better Home & Finance Holding Company) - Net Profit Rate|Net Sales Margin CVEO (civeo.com)|United Homes Group, Inc. (UHG) - Net Margin|SDHC - Net Margin|Company Sales Margin Stratus Properties Inc. STRS|Offerpad Solutions, Inc. (OPAD) - Net Margin|Net Margin Star Holdings Co. (STHO)|Net Margin Skyline Builders Corp.|INTG - Net Profitability Margin|Return on Sales by Net Profit SQFT (Presidio Property Trust)|Company Sales Margin Springview Holdings Limited|Net Sales Margin LRHC (La Rosa Holdings)|LSEA - Return on Sales by Net Profit|LUXH - Net Margin|NYMT - Net Sales Margin
