Liquidity Services Inc - LQDT Total Company Value-to-Revenue Ratio

Official company branding of Liquidity Services, Inc. (LQDT)

Scaling digital auctions for surplus public sector assets creates an immediate effect for Liquidity Services (LQDT). Revenue growth is driven by synergy with e-commerce and government agencies. The EV/Sales history illustrates the business valuation relative to sales, where 1720.07 expresses the current value of the metric. The efficiency of the operating model is based on the use of cloud providers and external property valuation experts.

LQDT (Liquidity Services, Inc.) Company Value to Revenue history from 11/23/2025 to 11/20/2026

LQDT (GovDeals): analytical breakdowns and indicator data
- share price and consensus valuation forecast:
Fundamental company valuation:LQDT, liquidityservices.com
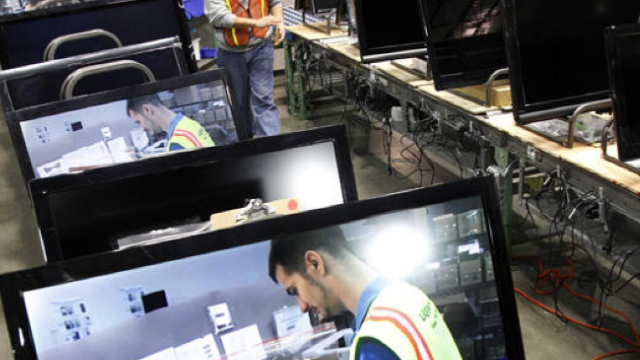
Product sample of Liquidity Services Corp

To objectively assess asset quality, an investor must analyze business value while accounting for its debt load. This indicator compares the total enterprise value to annual sales, eliminating the influence of capital structure. The EV/Revenue ratio trend clearly demonstrates the market's revaluation of the company's operational scale. For Liquidity Services (LQDT), this metric confirms the efficiency of the marketplace under Bill Angrick's leadership. Stable cash flow and an expanding customer base make the current valuation justified.

Competitor analysis

BABA: Enterprise Value-to-Revenue Ratio|PDD: EV/Sales Multiple|Enterprise Value-to-Revenue Multiple Mercado Libre (MELI)|DASH (DoorDash Corp) - EV/Sales Multiple|CPNG: Business Value to Revenue|Company Value to Revenue JD (Jingdong Mall)|CART (Instacart) - Business Value to Revenue|Enterprise Value-to-Revenue Ratio zto.com ZTO|Vipshop Holdings Limited (VIPS) - Enterprise Value-to-Revenue Multiple|GLBE - Enterprise Value-to-Revenue Ratio|Total Company Value-to-Revenue Ratio Pitney Bowes Inc. PBI|Jumia (JMIA) - Enterprise Value-to-Revenue Ratio|Enterprise Value-to-Sales Ratio xiaobaimaimai.com AHG|HEPS (D-MARKET) - EV/Sales Multiple|Marten Transport Ltd - Enterprise Value to Sales Volume|EV/Sales Multiple NEGG|Total Company Value-to-Revenue Ratio Serve Robotics Inc.|Enterprise Value-to-Revenue Ratio betterware.com.mx BWMX|LE: Company Value to Revenue Ratio|Dingdong - EV/Sales Multiple|ZKH: Enterprise Value-to-Revenue Ratio|AENT: EV/Sales Multiple|FLWS - Total Company Value-to-Revenue Ratio|FLX (BingEx Ltd.) - EV/Sales Multiple|HOUR: Business Value to Revenue|EV/Sales Multiple QVCGA|Enterprise Value-to-Revenue Ratio OCG (Oriental Culture Holding LTD)|EV/Sales Multiple NHTC (Natural Health Trends)|LITB: Company Value to Revenue Ratio|Linkage Global - EV/Sales Multiple|JX Luxventure Ltd - Enterprise Value-to-Revenue Coefficient|SOPA: EV/Sales Multiple|TGL (Treasure Global) - Enterprise Value-to-Revenue Ratio|YJ (Yunji Global) - EV/Sales Multiple|Company Value to Revenue Ratio JWEL (Jowell Global Limited)|EV/Sales Multiple JFBR|Company Value to Revenue Elite Express Holding ETS|EV/Sales Multiple BYON (Bed Bath & Beyond)|Dada Nexus - Enterprise Value-to-Revenue Ratio|Eightco Holdings Inc. - EV/Sales Multiple|Enterprise Value to Sales Volume PIK|Qurate Retail, Inc. (QRTEA) - Enterprise Value-to-Revenue Ratio