lloydsbankinggroup.com (LYG) Cash Funds Calculated per Share

Historically, the dominance of Lloyds Banking Group (LYG) in British deposits has ensured a stable cash flow. The change in cash per share reflects current resource dynamics, where the indicator value reaches 0.00. Looking ahead, reliance on the mortgage sector and payroll accounts guarantees returns, while digitalization through tech partnerships and government environmental initiatives will strengthen the bank's position.

Analytical breakdowns for Lloyds Banking Group
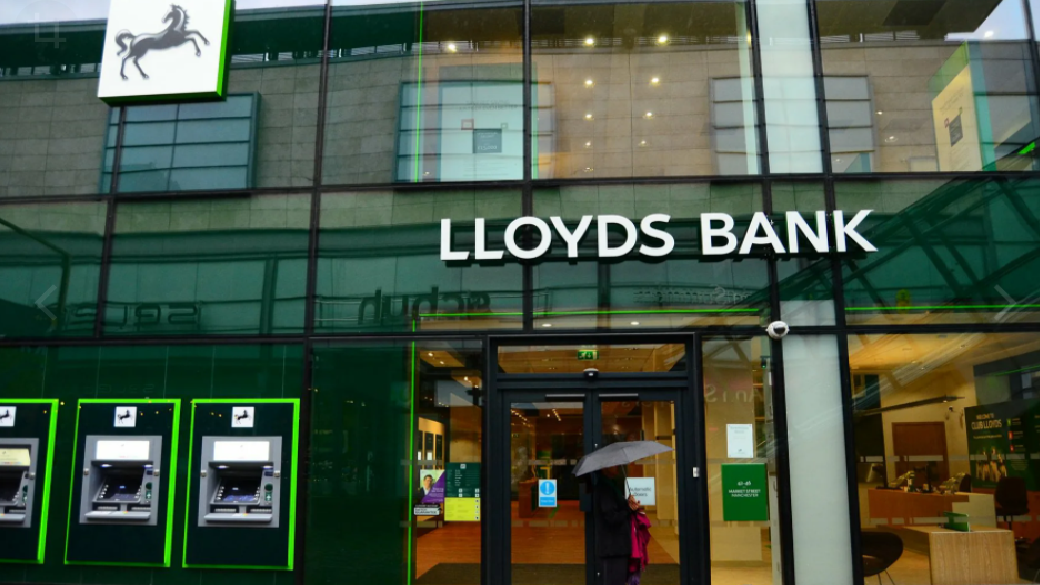
Dominating British retail banking, Lloyds Banking Group (LYG) is accumulating significant liquid reserves to fund digital transformation and mortgage growth. This metric is calculated as the ratio of total cash to the number of shares outstanding, reflecting the actual financial cushion and the balance between capital security and capital efficiency. By analyzing the annual trend of cash per share, an investor can assess the issuer's fundamental resilience during periods of market volatility.
