MI Homes (MHO): Enterprise Value to EBITDA Ratio
M/I Homes Inc (MHO) - corporate logo

The stability of M/I Homes, Inc. (MHO) is constrained by high sensitivity to mortgage rates and material inflation. The operational base suffers from unpredictable cash flows and a heavy dependence on the US housing market. The EV/EBITDA trend clearly confirms the impact of costs on margins, and 9.85 shows the current value of the metric, allowing for an assessment of the company's resilience to its debt load.

M/I Homes Corp - MHO Total Company Value to Operating Income Before Depreciation Ratio (period 11/23/2025 - 11/11/2026)
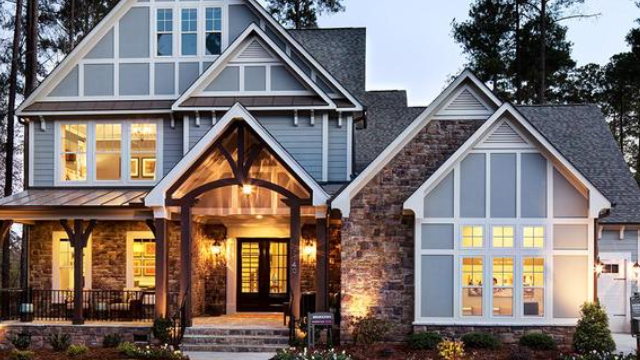
Original product of M/I Homes

To filter for high-quality assets, investors utilize the ratio of enterprise value to earnings before interest, taxes, depreciation, and amortization, excluding the influence of capital structure. This EV/EBITDA valuation multiple measures the company's payback period, which is critical for M/I Homes (MHO) as it implements costly robotics for frame construction and estimation software, reflecting the efficiency of capital expenditures during its digital transformation via this chart.

Analysis of competing companies

EV/EBITDA Multiple MAR (Marriott Hotels)|EV/EBITDA Multiple DR Horton America's Builder DHI|BEKE: Enterprise Value to EBITDA Ratio|tollbrothers.com - Enterprise Value to Operating Income Before Depreciation Ratio|FSV: EV/EBITDA Multiple|OPEN - Total Company Value to Operating Income Before Depreciation Ratio|Enterprise Value to Earnings Before Interest, Taxes, Depreciation and Amortization Taylor Morrison Home|Company Value to EBITDA Meritage MTH|Enterprise Value to Earnings Before Interest, Taxes, Depreciation and Amortization Millrose Properties Inc (MRP)|kbhome.com - Enterprise Value to Operating Income Before Depreciation|Enterprise Value to Earnings Before Interest, Taxes, Depreciation and Amortization Cavco Industries CVCO|SKY - Enterprise Value to EBITDA Ratio|Green Brick Homes - EV/EBITDA Multiple|Total Company Value to Operating Income Before Depreciation Ratio Tri Pointe Corp TPH|MGRC (McGrath RentCorp) - Enterprise Value to EBITDA Ratio|dreamfindershomes.com - Business Value to Operating Income Before Depreciation|CCS (Century Communities, Inc.) - EV/EBITDA Multiple|PRCH: Business Value to Operating Income Before Depreciation|Enterprise Value to Earnings Before Interest, Taxes, Depreciation and Amortization Elme (ELME)|LGIH - Company Value to EBITDA|Enterprise Value to Earnings Before Interest, Taxes, Depreciation and Amortization Target Hospitality Corp. TH|HOV - Enterprise Value to EBITDA Ratio|Anywhere Real Estate Inc. - EV/EBITDA Multiple|Company Value to EBITDA Beazer Homes USA|Legacy Housing Corporation Inc. (LEGH) - Enterprise Value to Earnings Before Interest, Taxes, Depreciation and Amortization|BETR - Total Company Value to Operating Income Before Depreciation Ratio|Enterprise Value to EBITDA Ratio CVEO|UHG: Business Value to Operating Income Before Depreciation|EV/EBITDA Multiple SDHC|Total Company Value to Operating Income Before Depreciation Ratio Stratus Properties, Inc.|Enterprise Value to Earnings Before Interest, Taxes, Depreciation and Amortization Offerpad Solutions, Inc. OPAD|STHO: Enterprise Value to Operating Income Before Depreciation|Skyline Builders - EV/EBITDA Multiple|The InterGroup (INTG) - Enterprise Value to EBITDA Ratio|SQFT (presidiopt.com) - Enterprise Value to EBITDA Ratio|SPHL - Total Company Value to Operating Income Before Depreciation Ratio|Enterprise Value to Earnings Before Interest, Taxes, Depreciation and Amortization La Rosa Holdings Corp|Enterprise Value to EBITDA Ratio Landsea (LSEA)|EV/EBITDA Multiple LUXH|NYMT (nymtrust.com) - Business Value to Operating Income Before Depreciation