MRCY (Mercury Corp) Net earnings per share (EPS TTM)

Mercury Systems, Inc. (MRCY) results depend on defense system upgrade cycles and the efficiency of module assembly outsourcing. The YoY EPS change on a rolling 12-month basis captures this trend, with the metric standing at 87.90. Strict control over certified component supply partners minimizes dependency risks and ensures the execution of strategic government contracts in the space sector.

MRCY (mrcy.com): analytical breakdowns and indicator data
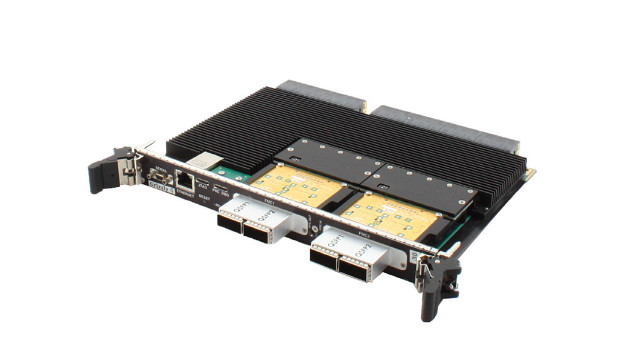
Mercury Systems occupies a strategic niche within the US defense sector, where stringent government standards and long-term contracts guarantee stable cash flows. By analyzing the year-over-year EPS dynamics over the last 12 months, an investor assesses the rate of change in net income per share, which allows for the determination of the business's real profitability vector and the timely adjustment of the investment horizon.
