Natural Gas Services Corp (NGS) Cash per Single Share

Natural Gas Services management is effectively capitalizing on the demand for high-capacity compression units. Fluctuations in cash per share visualize this success, which is driven by equipment leasing for gas transportation and leadership in the well pressure maintenance systems segment. Meanwhile, the 0.06 metric confirms the company's current liquidity level.

Analytical breakdowns for Natural Gas Services
- stock price and consensus target price:
- market capitalization details:
- balance sheet equity data:
- debt and solvency information:
Aggregate Debt to Capital Natural Gas Services|NGS - Long-Term Debt to Equity|Short-Term Debt to Capital Ratio Natural Gas Services Group|NGS - Company Aggregate Debts|Debts to Book Capitalization Natural Gas Services|NGS - Company Long-Term Liabilities|Amount of Current Liabilities Natural Gas Services Group|Quick Ratio ngsgi.com
- business earnings and investment ratios data:
NGS - Company Net Income|Expected Net Income Natural Gas Services|NGS - P/E Multiple|Forward P/E Multiple ngsgi.com|NGS - Price/Earnings to Growth Ratio|Enterprise Value to Earnings Before Interest, Taxes, Depreciation and Amortization Natural Gas Services|NGS - Operating profit before deduction of amortization|Earnings per share for the trailing year Natural Gas Services Group|NGS - Net earnings per share (EPS TTM)|Net earnings per share growth for the trailing year ngsgi.com|NGS - Earnings growth in current year|Earnings growth forecast for next year Natural Gas Services
- sales volume and revenue indicators:
- issuer financial margin indicators:
- cash and cash flow data:
Summary company analysis:NGS, Natural Gas Services
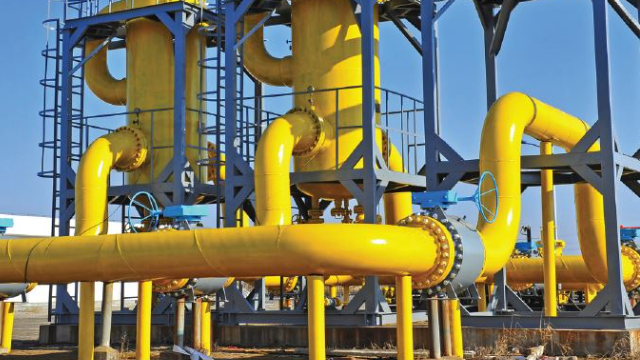
This indicator reflects the volume of liquid assets per common share, allowing for an assessment of the actual financial strength and capital management efficiency. Analyzing actual cash per share helps investors understand how aggressively Natural Gas Services (NGS) converts high rental rates for compressor equipment into hard reserves to ensure business sustainability.
Competing companies
nov.com - Cash Money per Share|Cash Funds per Share cactuswhd.com (WHD)|DXPE: Cash Money per Share|Cash Funds per Share DNOW Inc. DNOW|FLOC - Cash per Single Share|enerflex.com - Cash per Share|MRC (MRC Global Inc.) - Cash Funds per Single Share|Newpark (NPKI) - Cash Funds per Share|OIS: Cash Calculated per Single Share|FET (Forum Energy Corp) - Cash per Share|GEOS (Geospace Technologies Corp.) - Cash Calculated per Single Share|Cash Funds per Share OMS Energy Technologies (OMSE)|NCS Multistage Holdings - Cash Funds per Single Share|Cash per Share LSE (r-egroup.com)|Cash per Share Smart Sand, Inc. SND|Recon Technology - Cash per Share|KITT - Cash per Share|DRQ (Dril-Quip Inc.) - Cash per Single Share|Newpark Resources Corp - Amount of Cash per Share|PFIE (profireenergy.com) - Cash per Share|SDPI: Amount of Cash per Share
