National Presto Industries (NPK) Year-over-year earnings per share growth for the last twelve months

National Presto Industries - graphic logo of issuer NPK

Quarterly EPS dynamics for National Presto Industries (NPK) demonstrate the impact of cyclical government orders and inflationary pressure on margins. The 274.30 level reflects current profit levels supported by stringent product certification for the Pentagon. Business stability is based on long-term defense contracts and simultaneous shipments of home appliances to retail, which diversifies the company's cash flows.

NPK: gopresto.com Year-over-year earnings per share growth rate for the last twelve months 07/04/2022 - 11/18/2026

Analytical breakdowns and data insights for company gopresto.com (NPK)
- share price and consensus valuation forecast:
Analysis of all company metrics:National Presto Industries
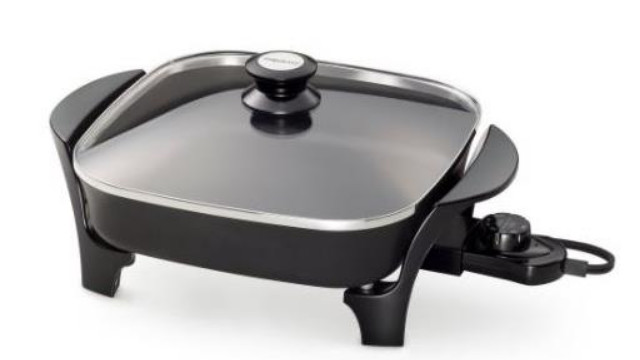
Manufactured product of National Presto Industries

National Presto Industries (NPK) is effectively monetizing record defense demand. The year-over-year net income per share trend reflects real efficiency in cost management. This metric measures the business's ability to offset raw material inflation under the rigid conditions of fixed contracts. Sharp spikes may signal temporary overheating rather than systemic growth. By analyzing quarterly earnings per share growth, investors assess the resilience of margins against government procurement cycles.

Key competitors

RTX (rtx.com) - Year-over-year net earnings per share growth for the last 12 months|Earnings per share growth in annualized terms for the last twelve months Lockheed (LMT)|Year-over-year net earnings per share growth for the last 12 months GD|Northrop Grumman Corporation (NOC) - Year-over-year net earnings per share change for the last twelve months|Year-over-year net earnings per share growth for the last 12 months LHX (L3Harris Technologies)|Year-over-year net earnings per share change for the last twelve months Elbit|Quarterly EPS earnings growth TXT (textron.com)|Year-over-year earnings per share growth rate for the last twelve months AVAV (AeroVironment Corp)|Kratos Defense & Security Solutions, Inc. - Quarterly EPS earnings growth|leonardodrs.com (DRS) - Year-over-year net earnings per share growth for the last 12 months|Huntington Ingalls Industries (HII) - Year-over-year earnings per share growth for the last twelve months|Year-over-year net earnings per share growth for the last 12 months Karman Holdings|Year-over-year earnings per share growth for the last twelve months olin.com|BigBear.ai Corp (BBAI) - Year-over-year net earnings per share change for the last twelve months|Quarterly EPS earnings growth CDRE|RCAT (Red Cat Holdings, Inc.) - Year-over-year earnings per one share growth for the last 12 months|ruger.com - Year-over-year net earnings per share growth for the last 12 months|Year-over-year net earnings per share change for the last twelve months AIRO Group Holdings Inc (AIRO)|BYRN - Year-over-year earnings per share growth for the last twelve months|Year-over-year net earnings per share change for the last twelve months American Outdoor Brands SWBI|ZENA: Quarterly EPS earnings growth|Earnings per share growth in annualized terms for the last twelve months AMMO (POWW)|Year-over-year earnings per share growth for the last twelve months VisionWave|SPAI: Year-over-year earnings per one share growth for the last 12 months|Year-over-year net earnings per share growth for the last 12 months WRAP (Wrap Technologies, Inc.)|PRZO - Earnings per share growth in annualized terms for the last twelve months|Quarterly EPS earnings growth DPRO (Draganfly, Inc.)|Year-over-year net earnings per share change for the last twelve months Ekso Bionics Holdings (EKSO)|DFSC: Year-over-year net earnings per share growth for the last 12 months|Year-over-year net earnings per share change for the last twelve months KWESST KWE