Nova Corp - NVMI Net earnings per share for the last 12 months

The AI boom is driving demand for Nova Ltd. (NVMI) metrology, as evidenced by the history of YoY (ttm) EPS percentage changes. A global presence across the US and Asia minimizes risks, while the recruitment of elite physicists ensures a technological edge. The value of 14.00 serves as the current indicator for this metric, demonstrating the link between market momentum and the business's actual profitability.

Financial and market metric breakdowns for Nova Ltd. (NVMI)
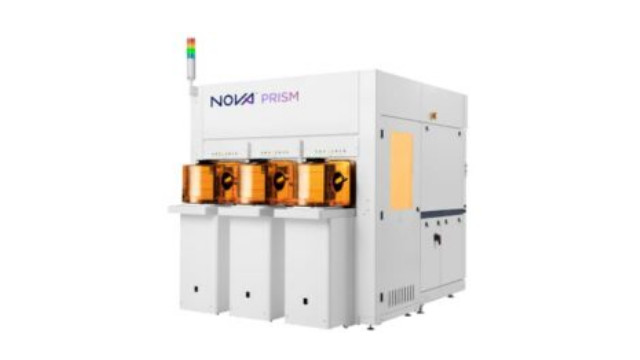
Year-over-year (TTM) EPS growth measures the dynamics of net income per share over a rolling year, neutralizing seasonal fluctuations. The current EPS YoY TTM trajectory demonstrates real capital resilience, stripped of quarterly lags. This metric is sensitive to operational efficiency, reflecting the business's ability to scale profitability. For Nova Ltd. (NVMI), this vector confirms the monetization of demand for metrology control as the industry transitions to GAA and 3D NAND process technologies.
