nVent Corp (NVT) Market Cap to Net Income Ratio

Demand for AI data center cooling and thermal management patents are driving quotes higher, as evidenced by the nVent Electric plc (NVT) P/E chart. The value 27.60 represents the current level of this metric. This efficiency is supported by global plants that minimize logistics, as well as skilled management focusing on return on equity and the modernization of infrastructure solutions within conservative niches.

Analytical breakdowns for nVent Electric plc
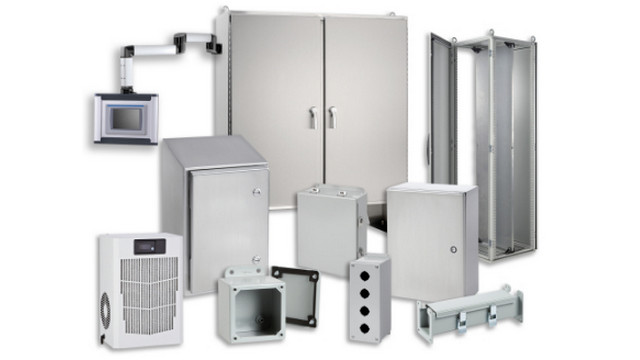
Effective management at nVent Electric plc (NVT) within the thermal management sector directly determines the company's historical average P/E ratio. This coefficient relates the current market price of the stock to the net profit per share, measuring the investment payback period. A decline in the multiple may signal undervaluation or risks, whereas growth indicates inflated market expectations. The stability of this metric confirms the resilience of the return on invested capital.
