Nexalin Technology, Inc. - NXL Revenue Change YoY (Last 12 Months)

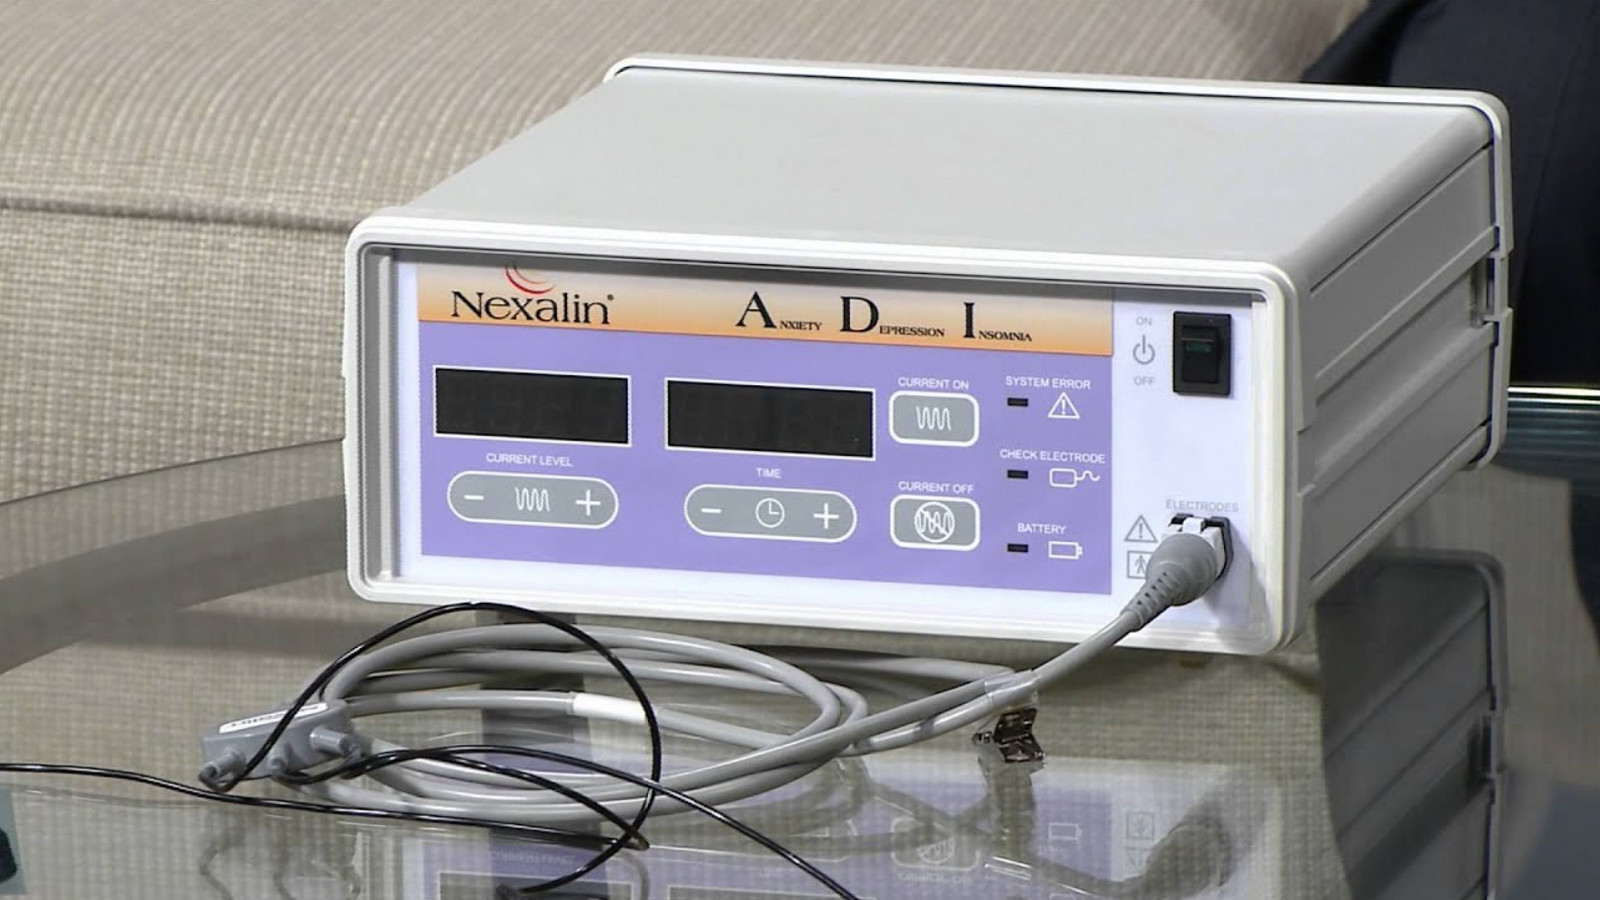
This 12-month YoY sales chart for Nexalin Technology, Inc. (NXL) demonstrates operational dynamics where 76.50 is the current value of the indicator. The business relies on the external launch of clinical trials and cloud services. Engineering is concentrated in the US, while device assembly has been outsourced to Asia to reduce costs. The company is currently optimizing its supply chains by selecting more cost-effective mass producers.

Summary analytical data breakdowns for nexalin.com (NXL)
This indicator measures the percentage change in revenue over the last twelve months relative to the preceding year, determining the business scaling rate. By analyzing the TTM revenue growth YoY, an investor assesses the real demand for the product. For Nexalin Technology, Inc. (NXL), stable laboratory utilization and the modernization of electronics control lines should convert into a positive trend. The upward curve confirms the efficiency of production capacities, serving as a signal for the strengthening of the asset's fundamental value.
