Omnicell Corp (OMCL) Market Cap to Earnings

Corporate emblem and logo of Omnicell Inc (OMCL)

Omnicell, Inc. (OMCL) focuses on SaaS solutions and robotics to eliminate medical errors. The company's fundamental P/E multiple on GURU.Markets reflects investor confidence trends, where the 36.50 mark captures this metric. High barriers to entry are driven by strict FDA and HIPAA regulations. Dominance in the hospital automation segment guarantees stable margins due to the complexity of infrastructure migration.

Price to Earnings Ratio: Omnicell Inc (OMCL) for 07/04/2022 - 11/13/2026

Comprehensive metric breakdowns and analytics for Omnicell Corp (OMCL)
- current price and projected stock value:
Summary company analysis:OMCL (omnicell.com)
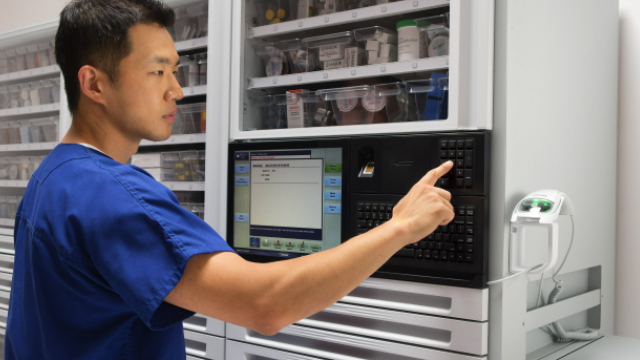
Manufactured product of Omnicell, Inc.

Conservative capital demands transparency in business valuation relative to its ability to generate real income. This indicator measures market capitalization through the lens of net income to determine the premium for future growth, which in the case of Omnicell, Inc. (OMCL) reflects the demand for pharmacy robotics and the transition to a SaaS model. Analyzing the P/E valuation multiple allows for the identification of an entry point when the company's technological potential is undervalued.

Analysis of competing companies

Price to Earnings Multiple VEEV (veeva.com)|Price to Earnings Ratio Doximity (DOCS)|HQY - Market Cap to Earnings|Price to Earnings Ratio Waystar Inc. WAY|CRVL - Price to Earnings Ratio|PRVA - Price to Earnings Ratio|HURN (huronconsultinggroup.com) - Price to Earnings Multiple|CERT: P/E Multiple|GDRX - Business Payback Period|SDGR (Schrödinger Inc.) - P/E Multiple|Price to Earnings Ratio Phreesia Health (PHR)|P/E Multiple OMDA|EVH - Market Cap to Earnings|Price to Earnings Ratio HealthStream HSTM|Definitive Healthcare Corp - Price to Earnings Ratio|CCSI - Price to Earnings Ratio|AGL: Price to Earnings Ratio|ABSI (Absci) - Price to Earnings Ratio|soyoung.com - Company Value to Net Income|NRC (National Research Corporation) - P/E Multiple|Spok Holdings Inc (SPOK) - Business Payback Period|Price to Earnings Ratio OptimizeRx Corp. (OPRX)|TruBridge Corp - Price to Earnings Multiple|P/E Multiple SLP (Simulations Plus, Inc.)|SOPH - Price to Earnings Ratio|HCAT: Price to Earnings Ratio|Business Payback Period CareCloud, Inc. CCLD|Research Solutions, Inc. (RSSS) - Price to Earnings Ratio|Market Cap to Earnings DLH Holdings (DLHC)|Price to Earnings Ratio OneMedNet Corp|Price to Earnings Ratio scienture.com (SCNX)|P/E Multiple HCTI|Price to Earnings Ratio ispecimen.com ISPC|Price to Earnings Ratio Bullfrog AI BFRG|SCWorx Inc - Price to Earnings Ratio|MSP Recovery Inc - P/E Multiple|Business Payback Period iCoreConnect Inc. ICCT|MEDS (TRxADE HEALTH) - Price to Earnings Ratio|ORGS: Market Price to Net Income Ratio|Price to Earnings Ratio RCM|SHCR: Company Value to Net Income|Price to Earnings Ratio Streamline Health Solutions (STRM)|Price to Earnings Ratio syrahealth.com SYRA|P/E Multiple AMEH (Apollo Medical Holdings, Inc.)|Model N Inc (MODN) - Market Cap to Earnings|NextGen - P/E Multiple