Ranpak - PACK Business Value to Revenue
Ranpak Holdings Corp. generates stable FCF through the leasing of packaging systems and the eco-trend. The historical EV/Sales trend on the GURU.Markets chart confirms this resilience, with the current level equal to 1508.12. The business scales alongside e-commerce while maintaining low costs. Equipment patents and customer service lock-in create significant barriers to entry for new players.

Ranpak Inc. - analytical breakdowns and key metrics (PACK)
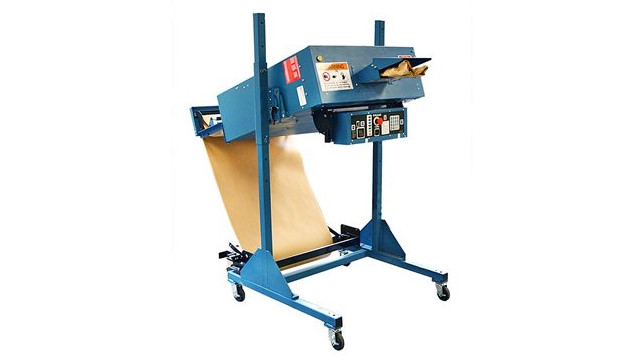
The EV/Sales metric assesses the value of Ranpak Holdings Corp. (PACK), including debt, relative to the volume of generated sales. It determines the market premium paid per unit of revenue, excluding the influence of capital structure. The trajectory of the company's value-to-revenue ratio reflects e-commerce demand for Ranpak Holdings Corp. (PACK) sustainable packaging. A steady influx of orders smooths out raw material volatility. This indicator allows for an objective assessment of the asset's investment potential within the context of industry growth.
